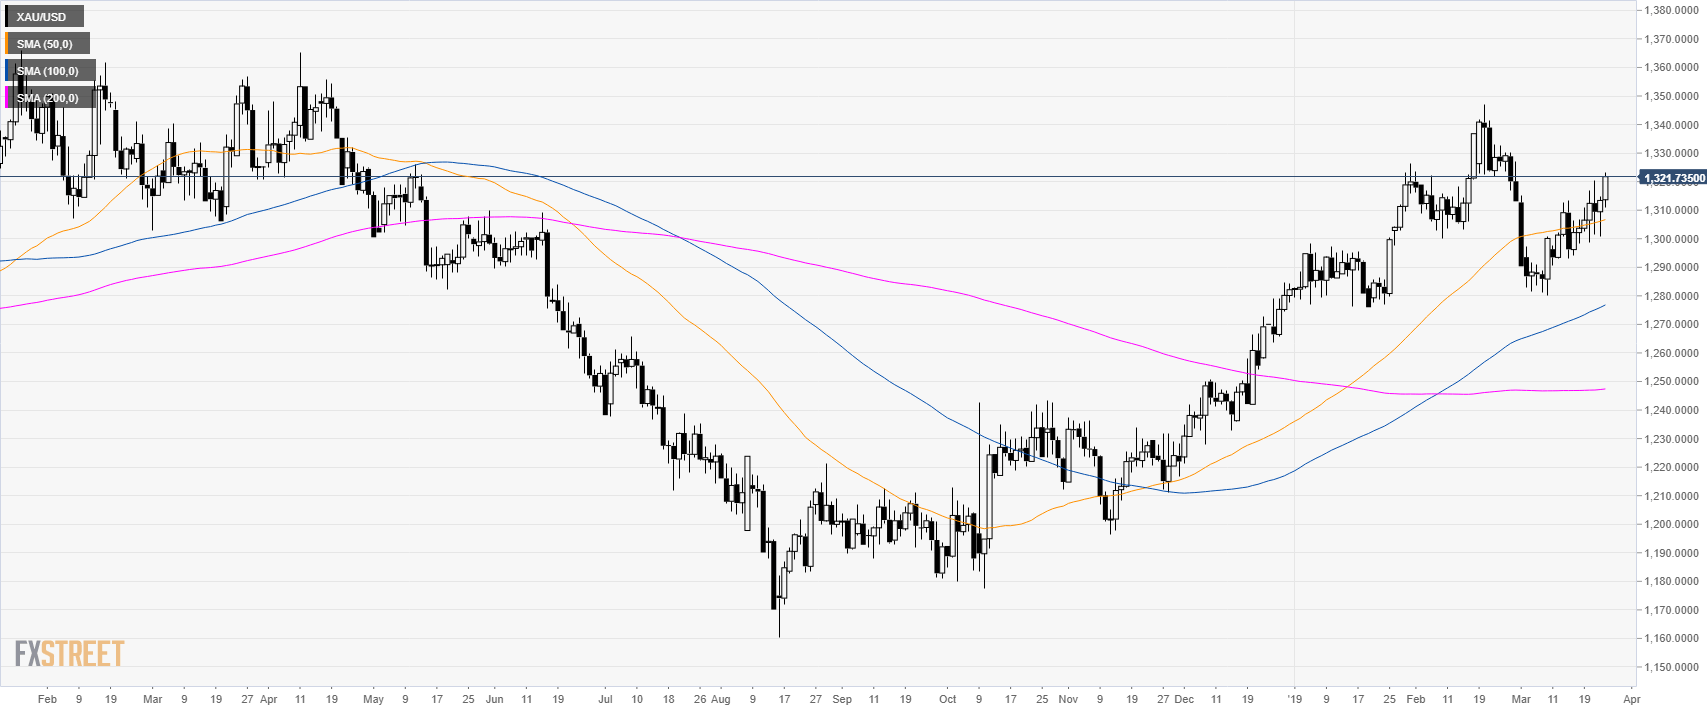
Gold daily chart
- Gold is trading in a bull trend above its main simple moving averages (SMAs).
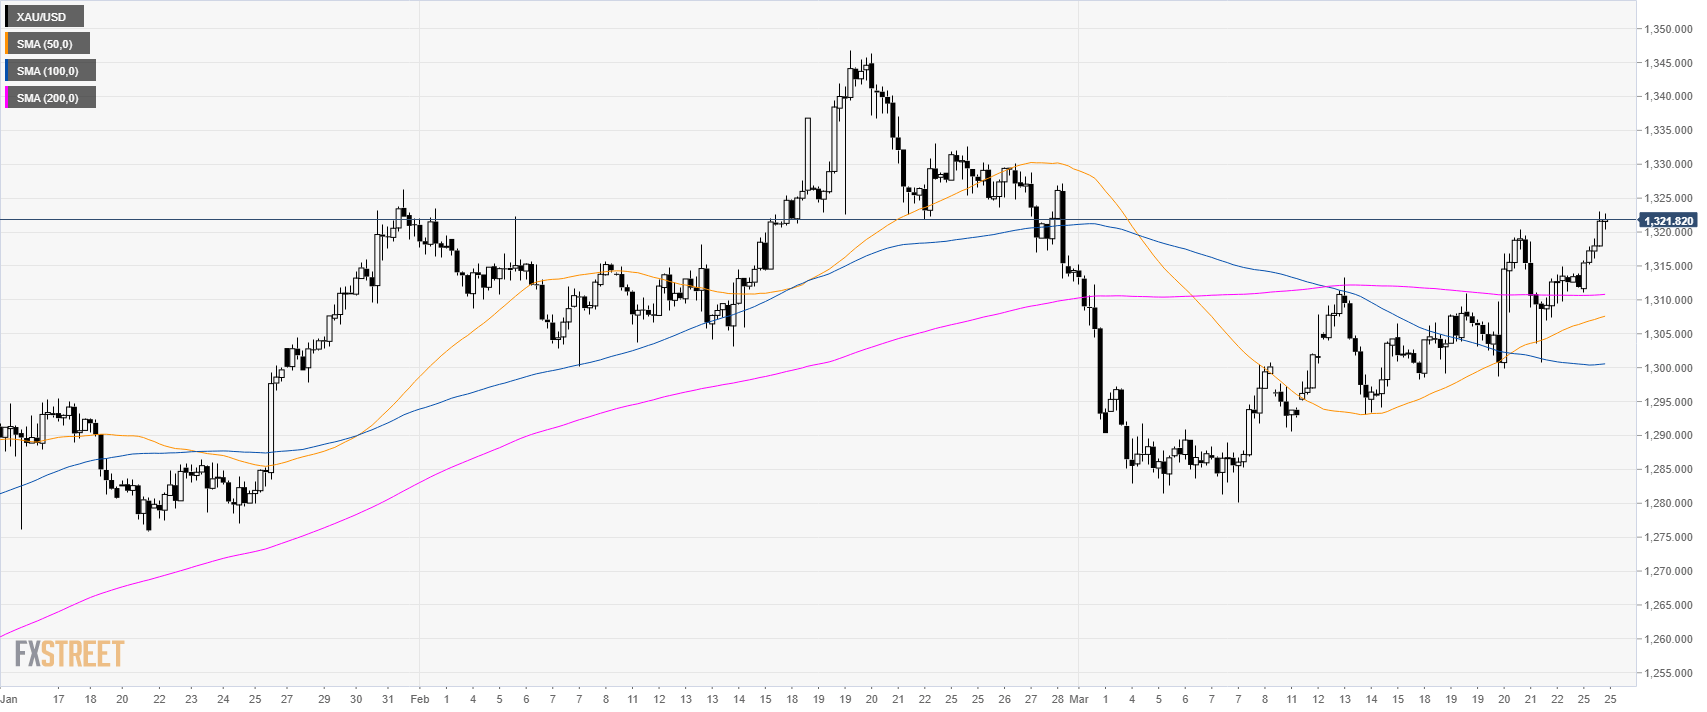
Gold 4-hour chart
- Gold is trading above its main SMAs suggesting a bullish bias in the medium-term.
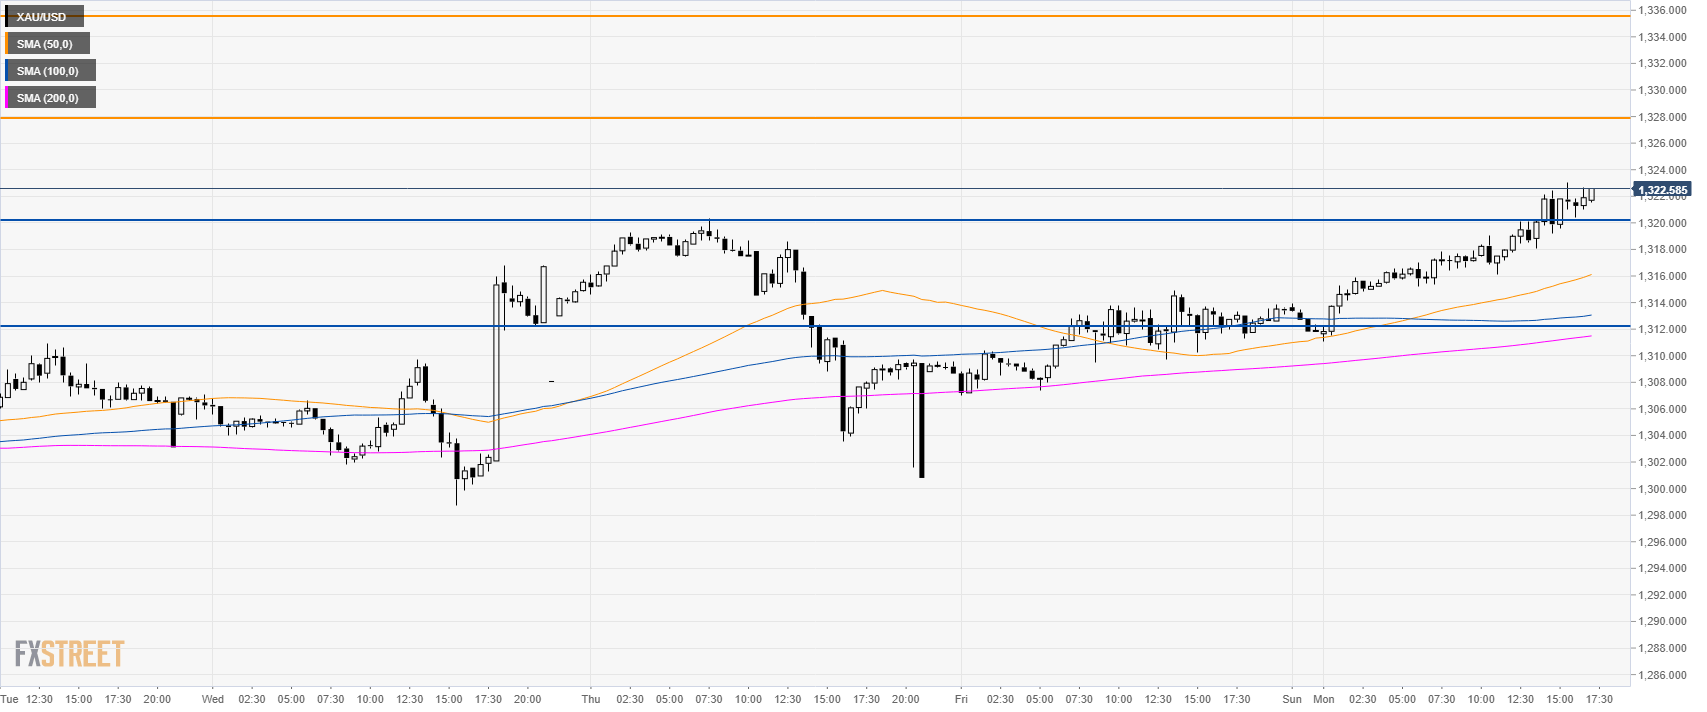
Gold 30-minute chart
- As the market is trading above its main SMAs bulls are currently in charge.
- The next resistances lying ahead are likely situated at 1,322.00; 1,328.00 and $1,336.00 once.
- Support is at 1,320.00 and 1,312.00.
Additional key levels
