- Gold is tradinag at multi-month highs above its main DSMAs.
- The level to beat for bulls is the 1,430.00 resistance.
Gold daily chart
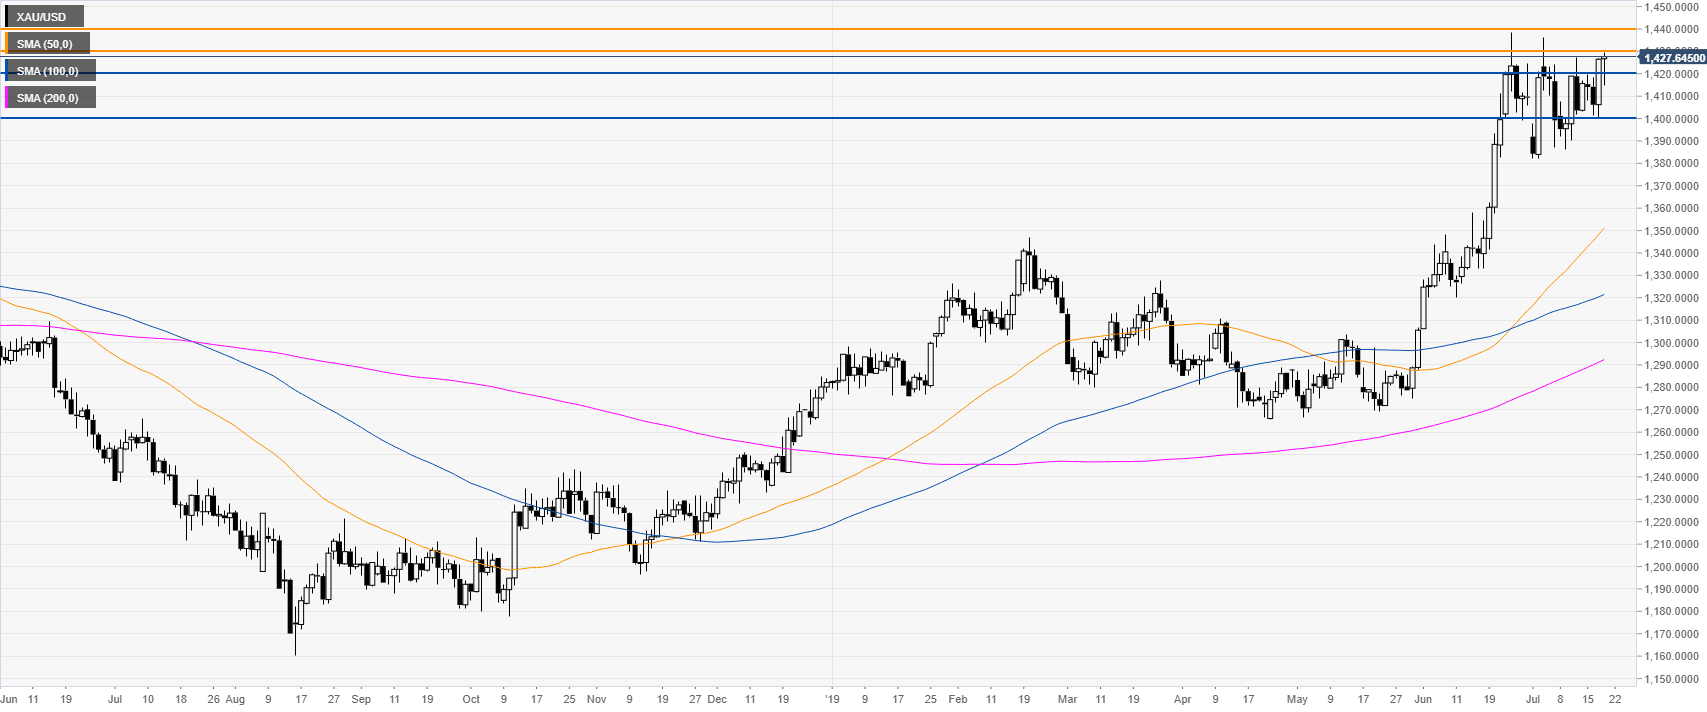
Gold is trading above its main daily simple moving averages (DSMAs) as the bulls are challenging the 1,430.00 resistance.
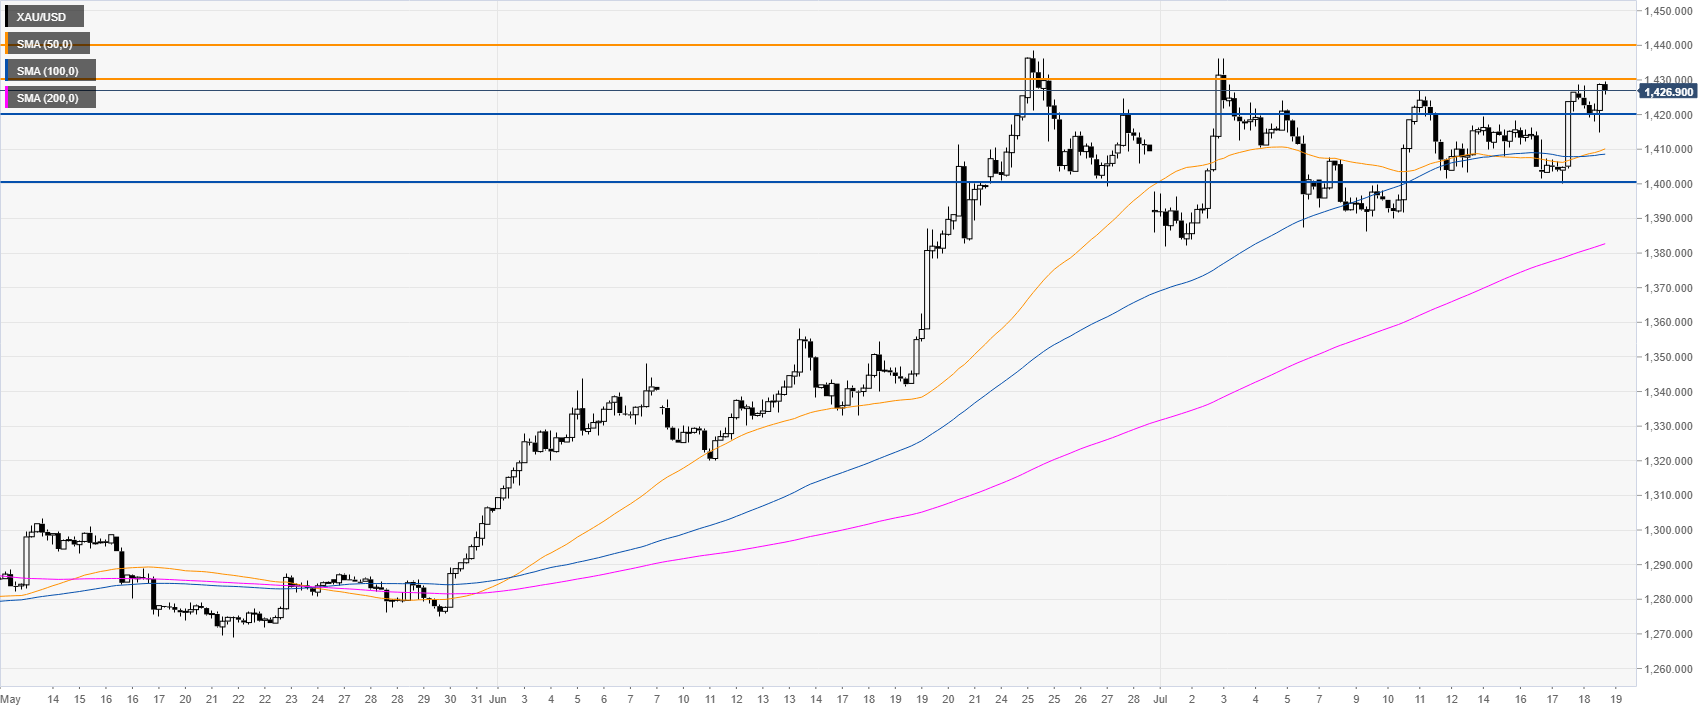
Gold 4-hour chart
The market is trading above the main SMAs suggesting a bullish bias in the medium term. If bulls can overcome the 1,430.00 resistance the market coule reach 1,440.00 on the way up.
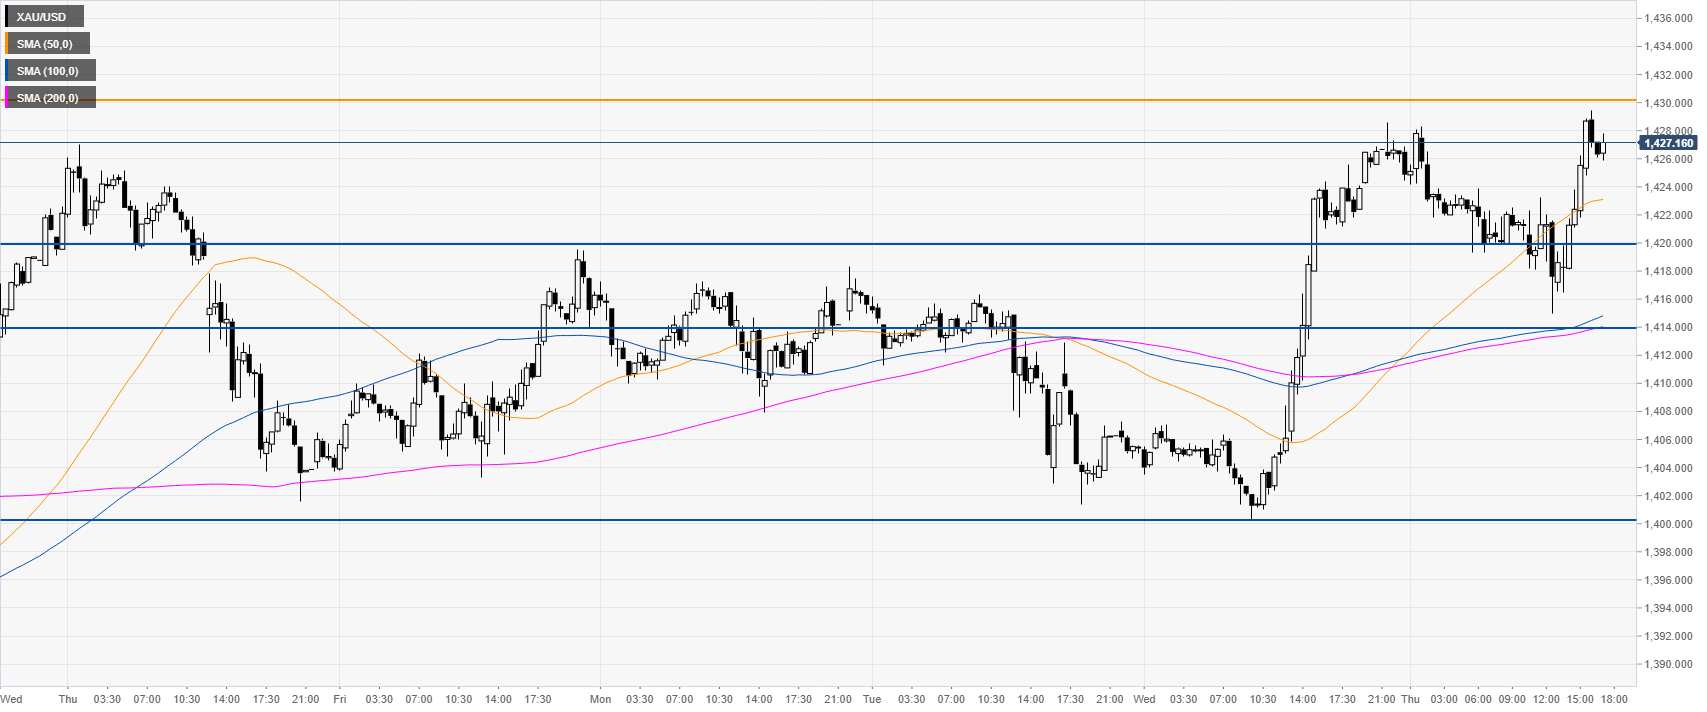
Gold 30-minute chart
A failure above 1,430.00 can lead to a potential retracement down towards 1,420.00 and 1,414.00 and the 1,400.0 handle.
Additional key levels
