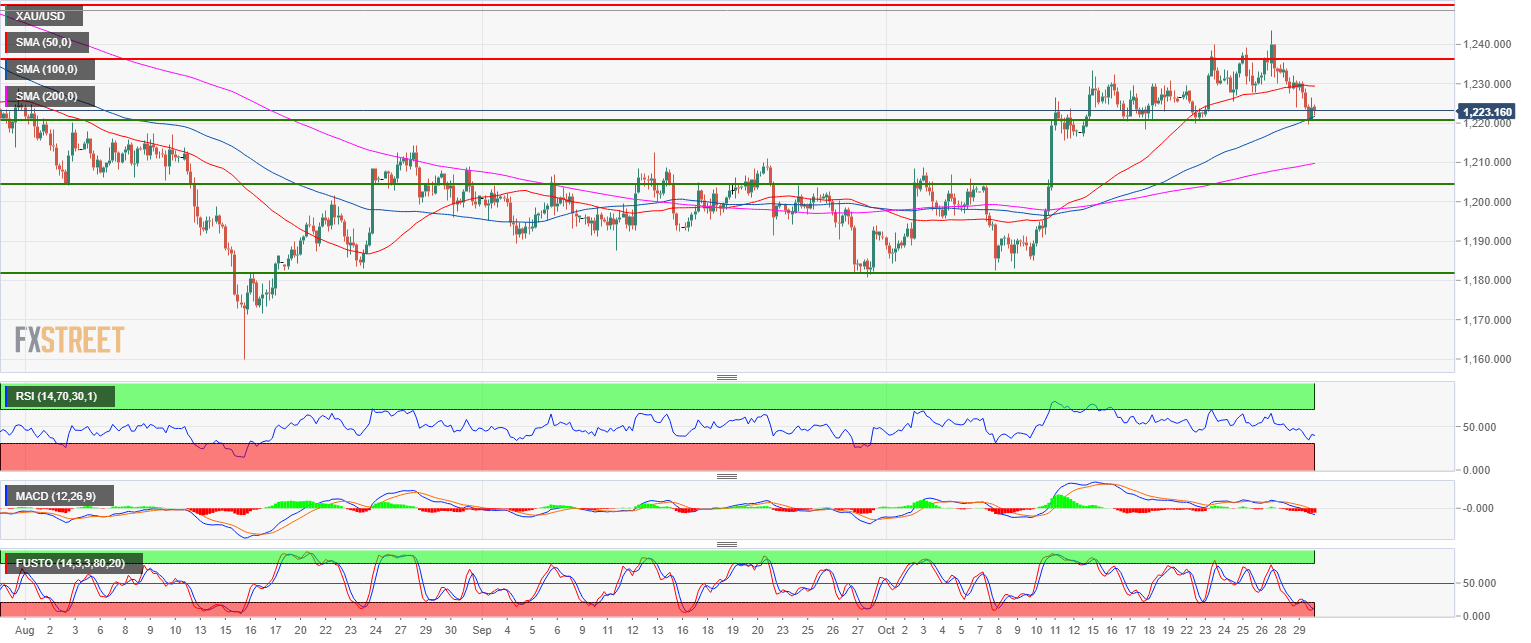
- Gold is trading in a bull trend above its 200-period simple moving average (SMA) on the 4-hour chart.
- Gold is currently retracing to the 1,220.90 support (July 18 low) and the 100 SMA. Bulls should try to support the market here.
- Alternatively, a break below the support can lead to a deeper pullback to 1,204.10 (August 3 swing low, key level). A break below 1,204.10 would likely invalidate the current bullish momentum.
Gold 4-hour chart
Main trend: Bullish
Resistance 1: 1,237.60 July 3 swing low
Resistance 2: 1,250.00 figure
Resistance 3: 1,265.90 July high
Resistance 4: 1,300.00 figure
Support 1: 1,220.90 July 18 low
Support 2: 1,211.17 July 19 low
Support 3: 1,204.10, August 3 swing low (key level)
Support 4: 1,182.90 August 24 low
Support 5: 1,172.82 current 2018 low
Additional key levels at a glance
XAU/USD
Overview:
Last Price: 1222.46
Daily change: -6.4e+2 pips
Daily change: -0.524%
Daily Open: 1228.9
Trends:
Daily SMA20: 1224.72
Daily SMA50: 1208.33
Daily SMA100: 1207.19
Daily SMA200: 1249.08
Levels:
Daily High: 1235.42
Daily Low: 1223.9
Weekly High: 1243.43
Weekly Low: 1219.9
Monthly High: 1212.64
Monthly Low: 1180.63
Daily Fibonacci 38.2%: 1228.3
Daily Fibonacci 61.8%: 1231.02
Daily Pivot Point S1: 1223.39
Daily Pivot Point S2: 1217.89
Daily Pivot Point S3: 1211.87
Daily Pivot Point R1: 1234.91
Daily Pivot Point R2: 1240.93
Daily Pivot Point R3: 1246.43
