- Gold price recovered most of the losses as the week ended.
- The slump in price was attributed to an upbeat US NFP.
- Falling US yields and missed data this week lent support to the precious metal.
The weekly forecast for gold remains bullish to neutral as the gains remain capped by key levels and potentially rebound of the Greenback next week.
As the US employment report accelerated sharply on Friday, August 6, the pair of XAU/USD has started the new week lagging, dropping to its lowest level since late March. As a result, gold accounted for most of its losses in the second rate. After falling as low as $1,687 on Monday, prices recovered to end the week at $1,730. A day after gaining more than 1% on Wednesday, XAU / USD remained calm on Thursday and continued to rise on Friday, closing the week in positive territory above $1770.
–Are you interested to learn more about day trading brokers? Check our detailed guide-
What happened last week?
As the week began, the unrelenting strength of XAU/USD forced the pair to continue its decline. With US Treasury yields rising, bullish data and restrictive Fed comments supporting the dollar, the US dollar index (DXY) rose to 93.00. According to data released Monday by the United States, JOLTS vacancies hit a record high in June, reaching a record bumblebee vacancy rate.
Furthermore, Richard Bostic, president of Atlantic Federal Reserve, has hinted that the Federal Reserve may reduce asset spending between October and December. Thomas Barkin, president of Richmond Federal Reserve Bank, has noted that the Federal Reserve is making significant progress in tightening the landmark.
–Are you interested to learn more about forex bonuses? Check our detailed guide-
However, after the July inflation report, the dollar came under modest selling pressure on Wednesday, rebounding gold. The core consumer price index (CPI), which does not include volatile prices, foodstuff products for consumer prices, or products for sale, fell to 4.3% yearly in July from 4.5% during June. The 10-year US Treasury bonds yield fell dramatically after this report, and the DXY ended a three-day winning streak.
On Thursday, gold fluctuated in a relatively narrow range around $1,750. The US Labor Department reported that initial jobless claims declined by 12,000 to 375,000 in the week ending August 7. In addition, the Bureau of Labor Statistics announced that the Producer Price Index for final demand rose by 7.8% over the same period.
An impending selloff in the dollar helped the XAU/USD to continue its recovery. In August, the University of Michigan Consumer Sentiment Index fell to 70.2, the lowest level in nearly a decade, while the Dow Jones Industrial Average fell more than 0.5%. But, of course, the drop of more than 4% in the yield on US 10-year Treasuries didn’t see the worse either, which wasn’t helpful.
Key events for Gold during Aug 16-20
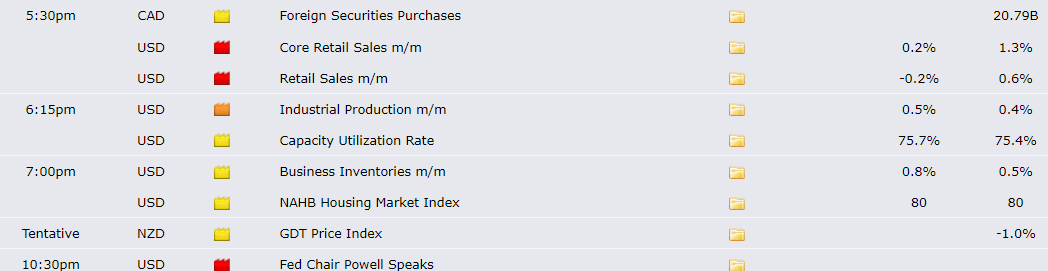

The US retail sales report for July will be released on Tuesday, the first major release of data for the week. Investors anticipate a 0.2% decline m/m after rising 0.6% to 0.6%. Despite disappointing pressures on the US dollar, the market response is likely to be short-lived, as investors are likely to remain on the sidelines in anticipation of the Jackson Hole symposium.
Eurozone economic data for July CPI will be released on Wednesday, and if EUR/USD does not react significantly, the US dollar could drop in value. Later that day, the FOMC will publish the minutes of the July meeting. Market participants will be looking for new clues as to when to roll back assets. If this release confirms that the Fed will begin tightening by the end of the year, the dollar could start outperforming its competitors, forcing XAU/USD to turn south.
The US will release its weekly Initial Jobless Claims report as the last data release of the week.
Gold weekly technical forecast: $1800 to act as a key
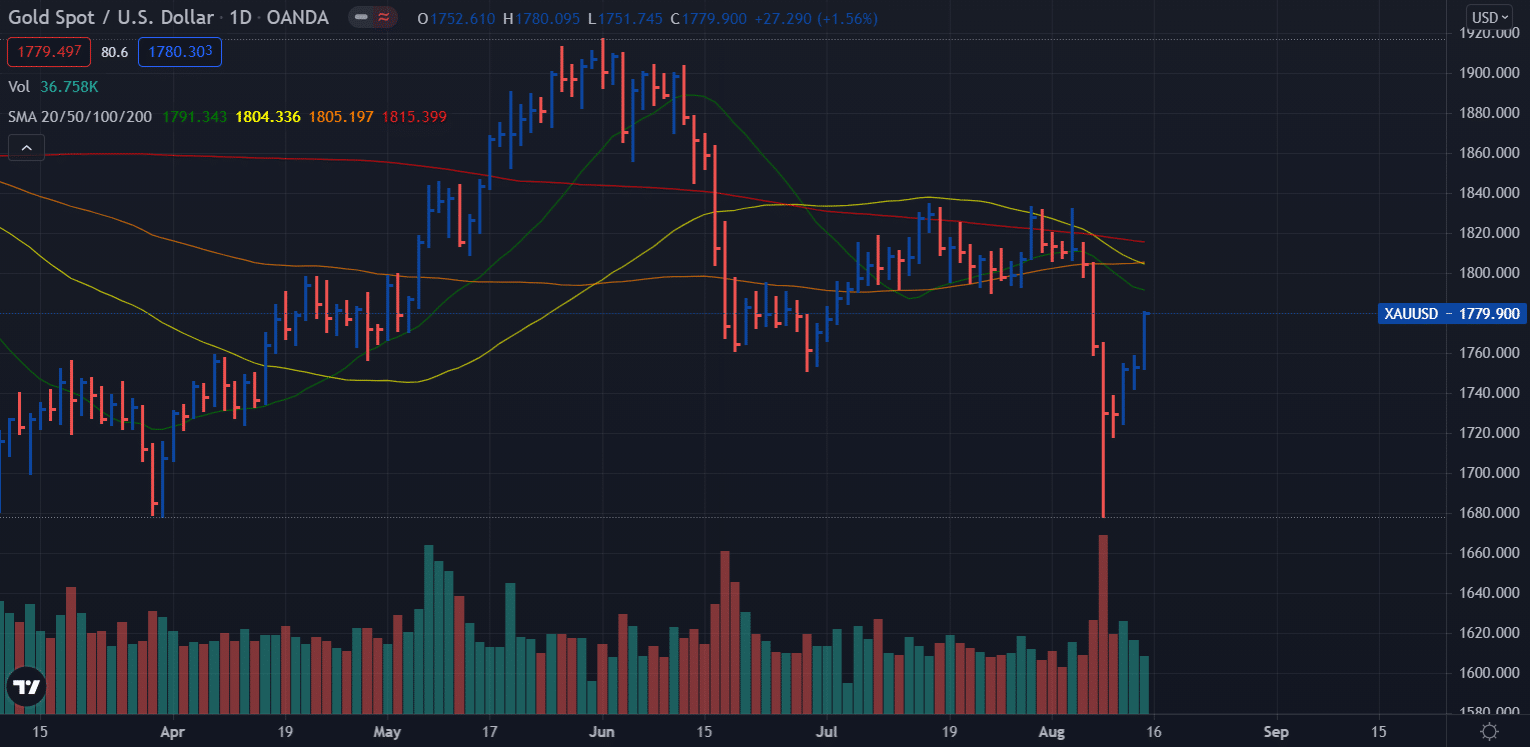
Despite the modest recovery of losses by the end of the week, the gold prices are still lagging below the key $1800 mark and 20-day SMA. Moreover, the volume of the rising wave is declining on the daily chart. Hence, the upside may lose traction around the $1790-1800 area.
Looking to trade forex now? Invest at eToro!
67% of retail investor accounts lose money when trading CFDs with this provider. You should consider whether you can afford to take the high risk of losing your money.
