- Gold is having a difficult time making a decisive move in either direction.
- Buyers failed to lift XAU/USD above key $1,745 resistance.
- A daily close below $1,720 could trigger a technical selloff.
The XAU/USD pair struggled to find direction and fluctuated in a relatively tight range throughout the week as key technical levels remained intact. Although the greenback continued to outperform its major rivals on the back of upbeat data releases, XAU/USD stayed relatively calm as the inversely correlated 10-year US Treasury bond yield staged a deep correction and snapped a seven-week rising streak. Ahead of the weekend, the USD struggled to find demand but the recovering US T-bond yields did not allow gold to gain traction. Following the choppy action, XAU/USD closed the week with small losses a little above $1,730.
What happened last week
While testifying before the US House Committee on Financial Services on the Federal Reserve’s response to the coronavirus crisis on Monday, FOMC Chairman Jerome Powell reiterated that the Fed is committed to using the full range of tools to support the economy. Regarding concerns over potential asset bubbles forming amid the Fed’s ultra-loose policy, “some asset prices are a bit high but funding risk is relatively modest and banks are well-capitalized,” Powell noted. Furthermore, the chairman downplayed the impact of rising US Treasury bond yields and argued that they were reflecting the sense of an improved economic outlook.
Meanwhile, Dallas Fed President Robert Kaplan told CNBC on Tuesday that he expected the Fed to start raising rates in 2020 while acknowledging that his economic forecasts had improved significantly. “My forecast for removing accommodation is more aggressive than the median Fed official,” Kaplan added, and these hawkish remarks helped the USD preserve its strength.
The IHS Markit’s preliminary PMI reports revealed on Wednesday that the economic activity both in the manufacturing and the services sectors continued to expand at a strong pace. Additionally, the US Bureau of Economic Analysis (BEA) reported on Thursday that it revised the fourth-quarter real Gross Domestic Product (GDP) growth to 4.3% from 4.1% in the previous estimate. Confirming the robust economic rebound, the US Department of Labor’s weekly Initial Jobless Claims dropped to the lowest level since the beginning of the pandemic at 684,000 in the week ending March 20.
Friday’s data showed that Personal Spending and Personal Income in February contracted by 1% and 7.1%, respectively. However, these figures failed to trigger a meaningful market reaction as they were attributed to severe weather conditions. Finally, the BEA announced that the Core Personal Consumption Expenditures (PCE) Price Index, the Fed’s preferred gauge of inflation, edged lower to 1.4% in February from 1.5% in January.
Next week
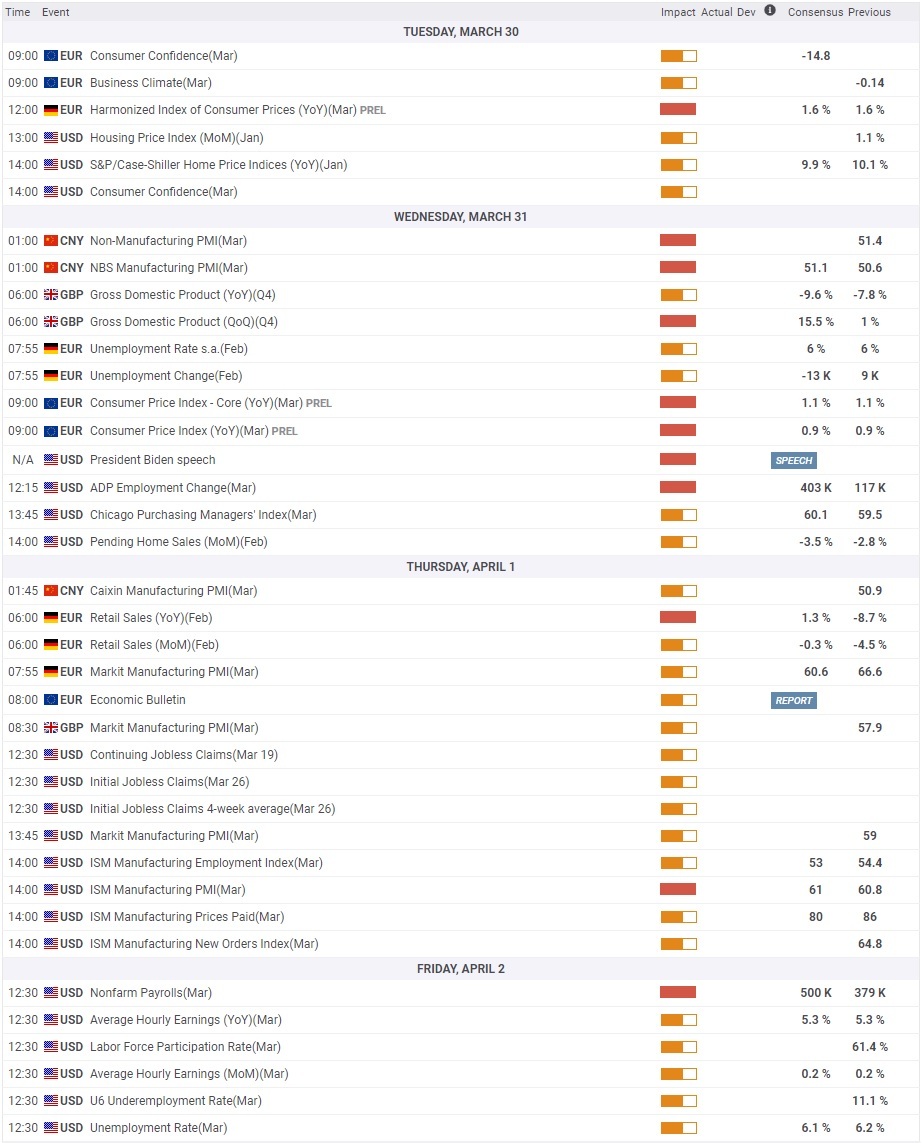
The Conference Board’s Consumer Confidence Index on Tuesday will be the first data from the US that has the potential to affect the market’s risk perception. Until then, investors will keep a close eye on US T-bond yields. Strong resistance seems to have formed at 1.75% for the benchmark 10-year US T-bond yield and gold could come under pressure with a break above that level.
On Wednesday, the Automatic Data Processing (ADP) Research Institute will publish the private sector employment report, which is expected to show an increase of 403,000 in payrolls in March. On Thursday, the ISM Manufacturing PMI will be featured in the US economic docket ahead of Friday’s Nonfarm Payrolls (NFP) report. Usually, the NFP is seen as high-impact data that could ramp up market volatility with a large divergence from the market consensus. However, the trading action in financial markets is likely to turn subdued with trading conditions thinning out due to the Good Friday holiday.
Gold technical outlook
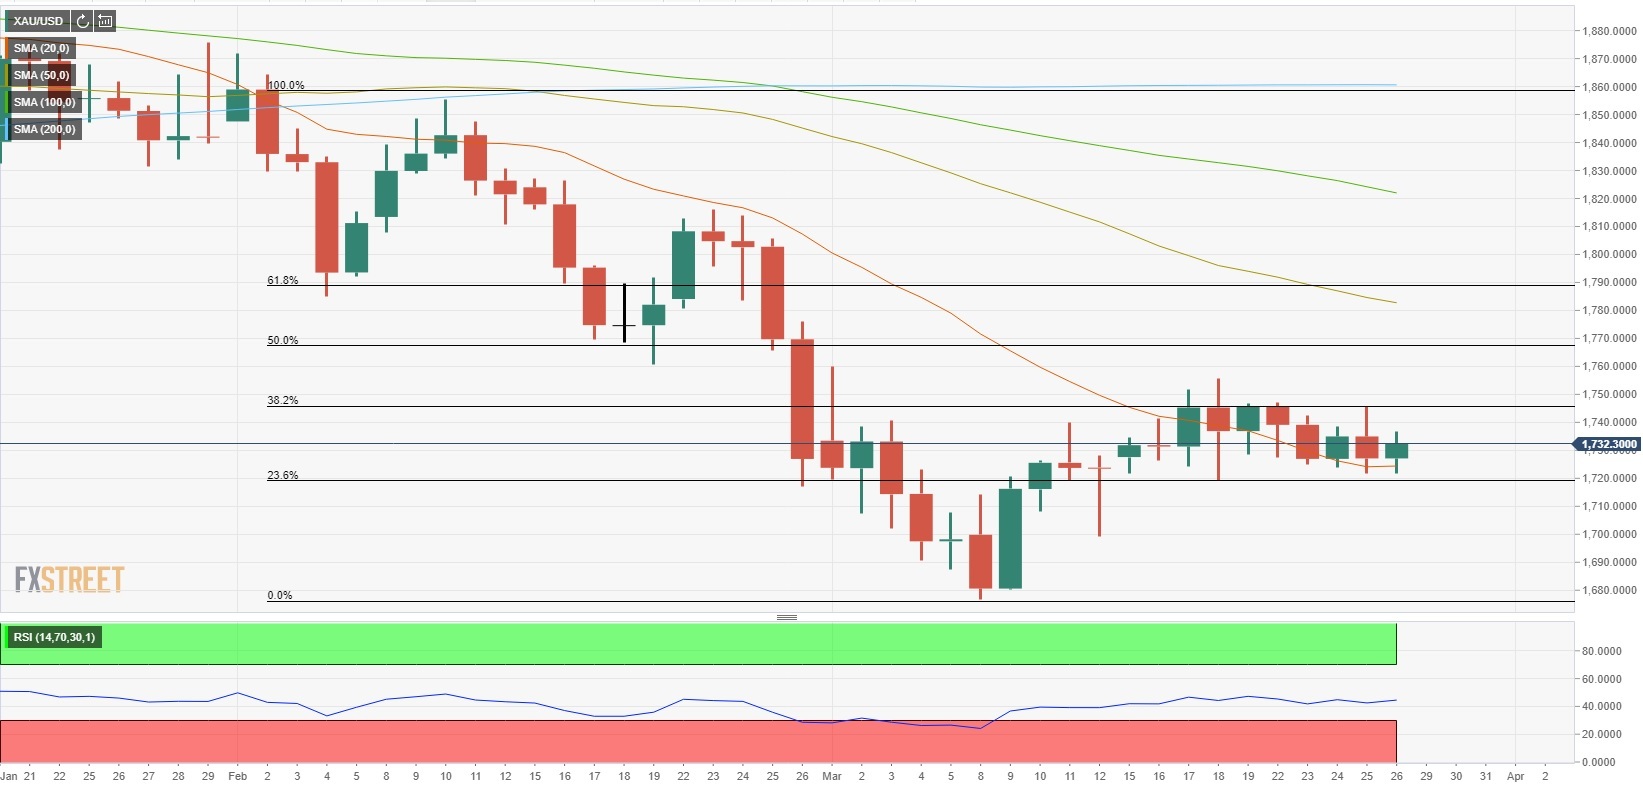
The near-term technical picture points to a neutral stance with a modestly bearish bias. However, the fact that price closed above the 20-day SMA for the third straight day suggests that sellers remain reluctant. The Relative Strength Index (RSI) indicator on the daily chart continues to move sideways a little below 50.
On the downside, the initial support is located at $1,724 (20-day SMA) ahead of the key $1,720 (Fibonacci 23.6% retracement of the Feb. 2-Mar. 8 drop) level. A daily close below the latter could trigger a technical selloff toward $1,700 (psychological level).
On the other hand, strong resistance is located at $1,745 (Fibonacci 38.2% retracement) before $1,767 (Fibonacci 50% retracement) and $1,780 (50-day SMA). A bullish shift in the technical outlook could occur if gold manages to flip $1,745 as support.
Gold sentiment poll
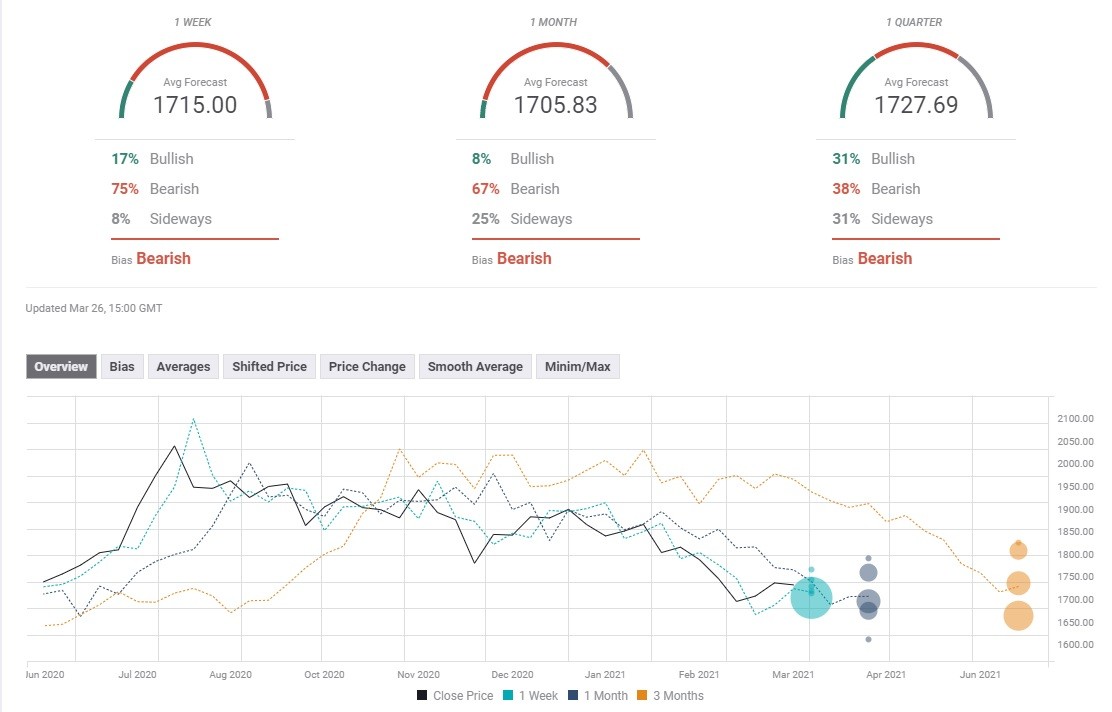
The FXStreet Forecast Poll shows that the majority of experts expect gold to edge lower next week and in April. The average price target sits at $1,715 and $1,705 on a one-week and one-month view, respectively.