This strategy is based on an amazing Japanese indicator – Ichimoku Kinko Hyo. The system is used to catch the trend as its name suggests. It uses only one indicator though it can be combined with MACD to find better trade setups or conditions to close position. The system uses both Clouds and its 2 trend lines – Kijun-Sen and Tenkan-Sen. Ichimoku Clouds are used to identify trend direction. So, if the pair is trading below the Clouds – downtrend is in place. When a pair trades above the clouds – a sign of uptrend. Kijun-sen and Tenkan-Sen are used as typical trending such as Moving Average.
Both lines good support/resistance for a currency pair – in the trending environment a pair typically retreats to one of the lines and resumes its trend. Kijun-Sen and Tenkan-Sen provide extremely good support/resistance often better than EMA or SMA. This feature of the Ichimoku is used in this strategy. Ichimoku Clouds identify trend direction and also provide support/resistance as a pair often retreats back to them and resumes the main trend. The system works very well in trending markets while it fares much worse in ranging environment.
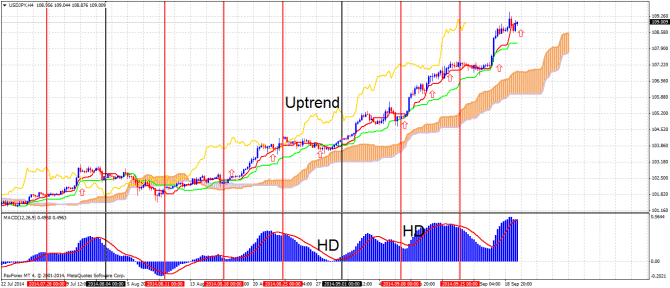
The strategy can be combined with MACD to give signals with higher accuracy when MACD shows hidden divergence and possible trend resumption. Other way to combine it with MACD is to use trend reversal signal provided by this oscillator to close positions.
The strategy can be used on any timeframe and currency pair, but it works better on 4H chart. Only 2 signals from Tenkan-Sen(red line) are used and each signal from Kijun-Sen(green line). As the pair retreats back to Kijun-Sen, again 2 Tenkan-Sen signals used and so on. Move Stop-Loss to break-even as the position makes profit twice as much as initial S/L.
Here are conditions for BUY:
- The pair is trending up as it is above Ichimoku Clouds.
- The pair retreats back to Kijun-Sen(green line) ro Tenkan-Sen(red line). Support provided by market profile can also be used. For example daily/weekly Point of Control(POC) or Value Area Low/High. Important Fibonacci level can also be used as support/resistance.
- The pair resumes its rally as it climbs above previous candlestick triggering BUY signal.
There are conditions for SELL:
- The pair is trending down as it lies below Ichimoku Clouds.
- The pair retreats back to Kijun-Sen or Tenkan-Sen. Support provided by market profile or Fibonacci can also be used, but it should be near one of these Ichimoku lines.
- The pair resumes decline as it falls below previous candlestick..
Closing rules:
There are several ideas where to close the position. Some predefined point can be used as take-profit. For example, position can be closed with some predefined Reward-Risk ratio. Other idea is to close as a pair reaches strong support/resistance predicted by Fibonacci or Market Profile. MACD divergence on higher timeframe can also be used to close a trade. For example, if the signal is sent at 107.20 and initial S/L is at 106.95 as the pair soars to 107.70 move S/L to break-even. If the trade was opened with RR of 8:1, set T/P at 109.20 to make 200 point of profit. Set S/L slightly below the recent Low.
Guest post by Dmytro Nest from NestFX.com
