When it comes to Forex trading, the forex economic calendar is a very useful tool to determine entry and exit points. As most of us know, timing is everything. That’s why the date and time listings of upcoming market-relevant events are so important to keep an eye on.
However, there is another very powerful tool to take advantage of, if you know how to use it correctly: the Fibonacci Retracement & Extension tool.
In fact, the Fibonacci spiral is part of many nature’s structures and you can find the golden ratio everywhere. In this article, I will shed light on the numerous ways of using Fibonacci as a powerful tool to make your trading more profitable.
Fibonacci Retracement
The Fibonacci Retracement is used to find additional supports and resistances between a given low and high. As you connect the low with the high when using the Fibonacci retracement tool, the 1 must be at the low while the 0 must be at the top. This is because the Fibonacci retracement is used to give areas of potential trend reversals. Fibonacci retracement levels are 23.6%, 38.2%, 50%, 61.8% and 78.6%, although 50% is not officially a Fibonacci ratio. Thus, if the price reaches the 23.6% level, it means the price has declined 23.6% from its high where the Fibonacci level is 0 (because at the high, the price declined 0 percent from its highest point).
Ideally, you take the most recent low after the latest surge in price. How this looks like is seen in the example below.
Golden Pocket
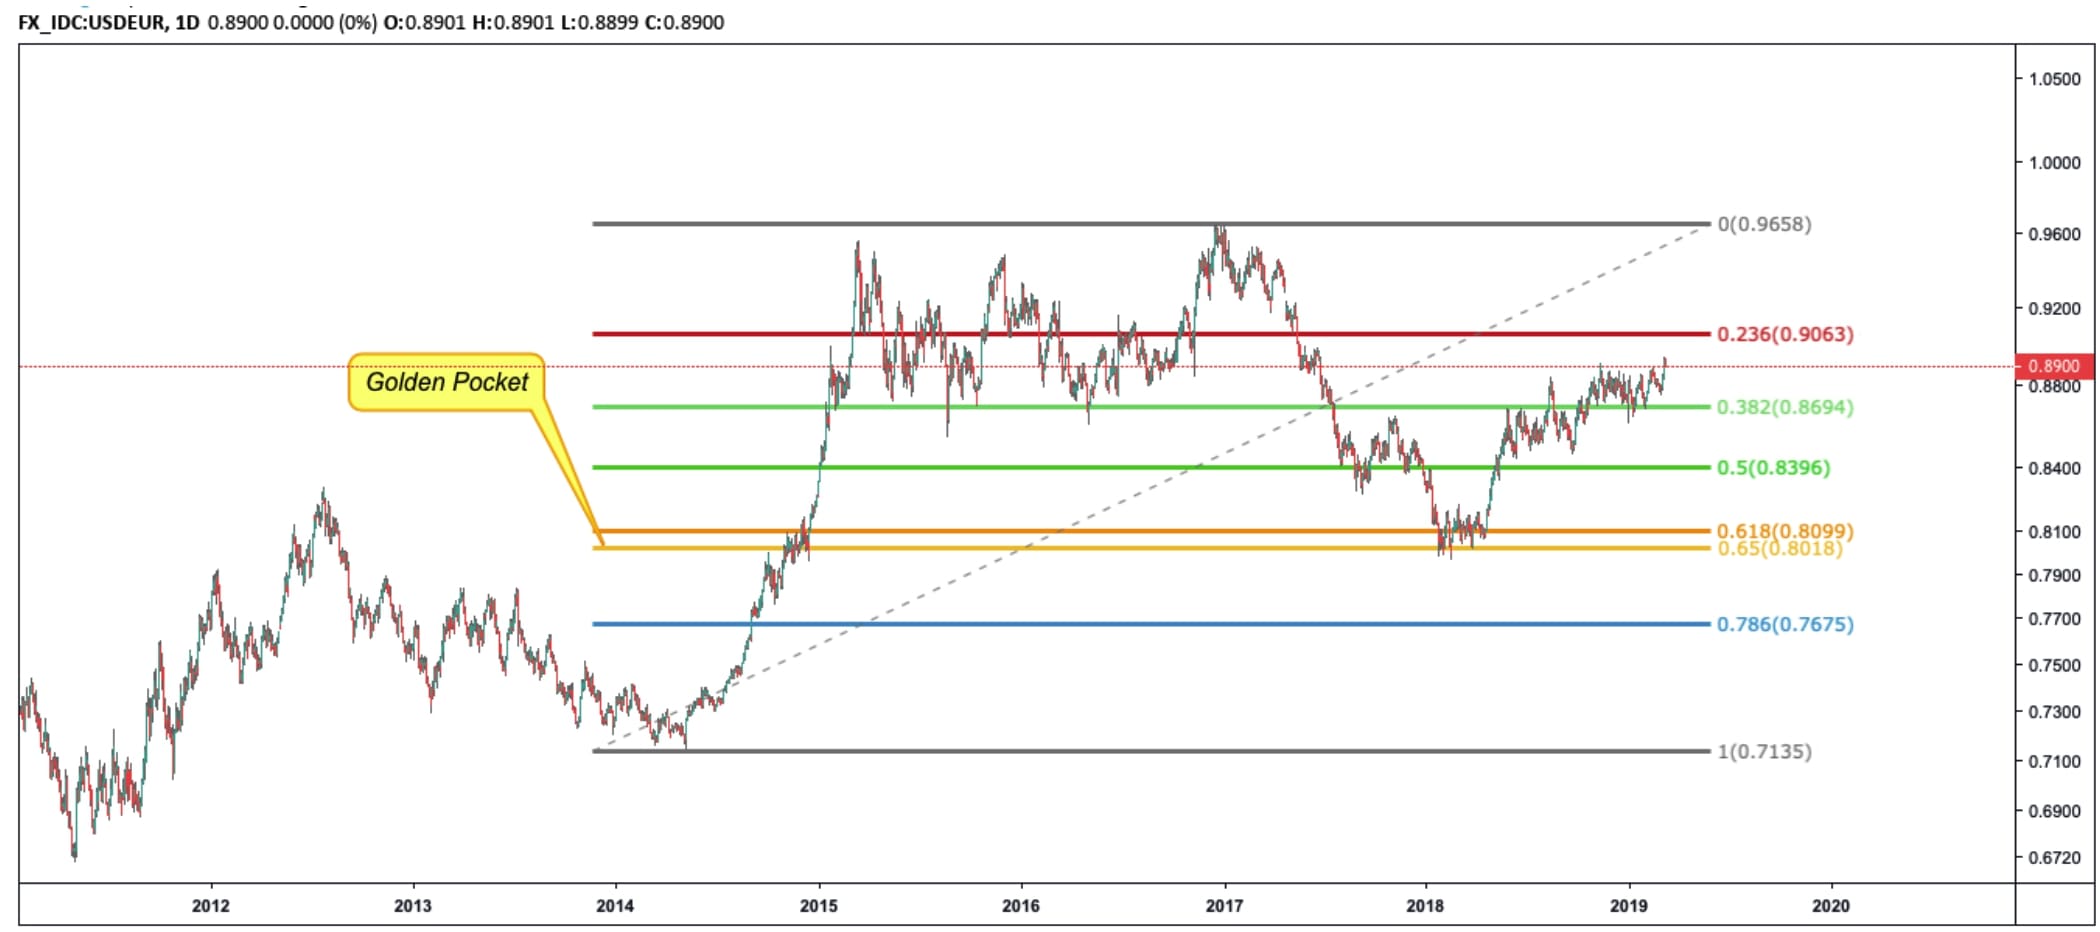
A very important level is the golden pocket, defined as the area between 0.618 and 0.65. The price very often declines to this level and bounces heavily off this area, which is why the golden pocket is a very popular entry-level if you assume bullishness.
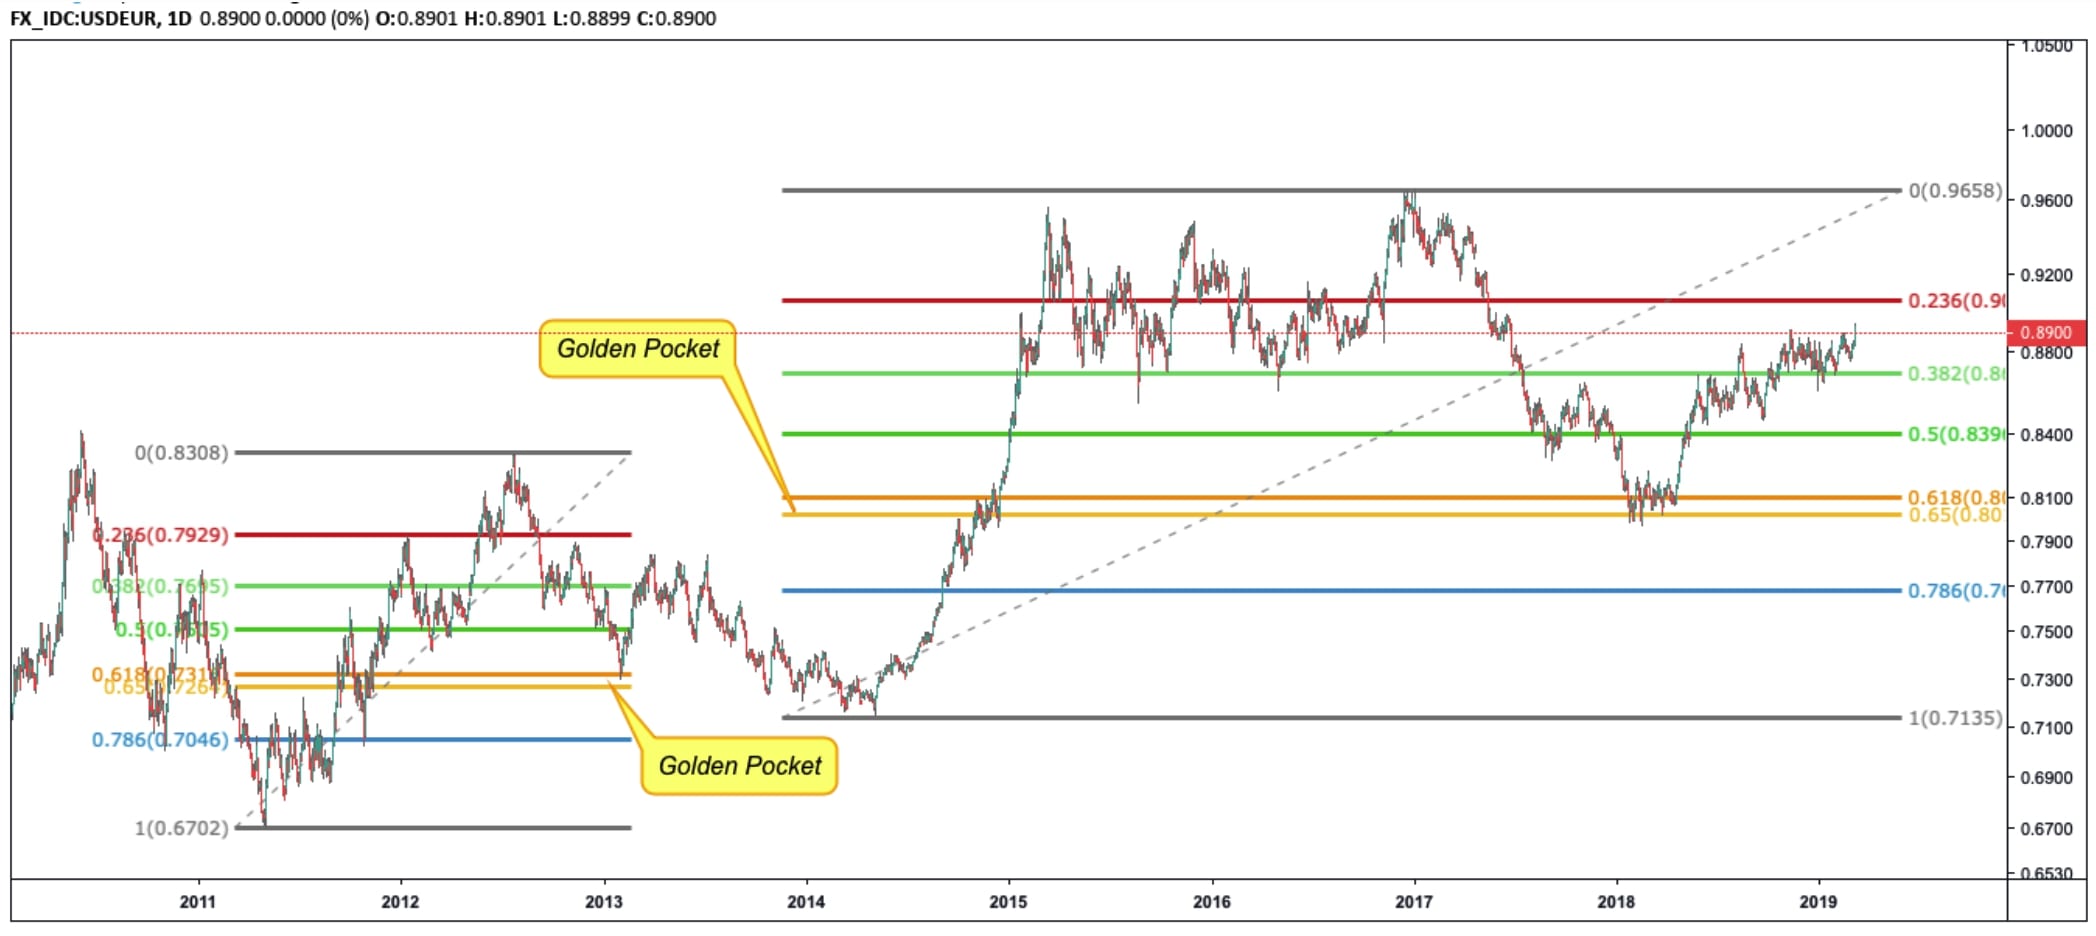
As you can see in both examples, the price bounced heavily off this level which resulted in a surge in price by 9 to 12 percent.
Another important level which often acts as support is the 0.382 fib level.
To conclude, if you are looking for an entry-level after the price of a given security, asset, or currency has significantly surged already, you must make sure you identify the top in order to successfully use the Fibonacci retracement tool. Once identified, you can use the Fibonacci levels as support levels, placing longs at the levels. The golden pocket level is the area where the price most likely reverses and the 0.382 fib level is the second strongest support level of the Fibonacci retracement tool.
Fibonacci Extension
The same principle holds true the other way around. If you want to find potential resistances to place your sell orders (targets of longs or entries of shorts), you should use the Fibonacci extension tool. This tool is used almost the same, but instead of placing the 0 at the top, 0 is placed at the low. Thus, you start with the most recent high and connect it with the low.
This allows you to find the next resistance. In the example below, you can see that the price was first rejected at the 0.382 fib level, at the level where the price is likely to reverse, either in a downtrend or in an uptrend. What’s more, the price found support at the 0.236 fib level and broke the all of the fib levels easily, to find its next rejection by the 0.786 fib level resistance. This was followed by a decline down to the 0.236 fib support, which held successfully again and resulted in a rise all the way up to the 0.786 fib level again, and so on and so forth.
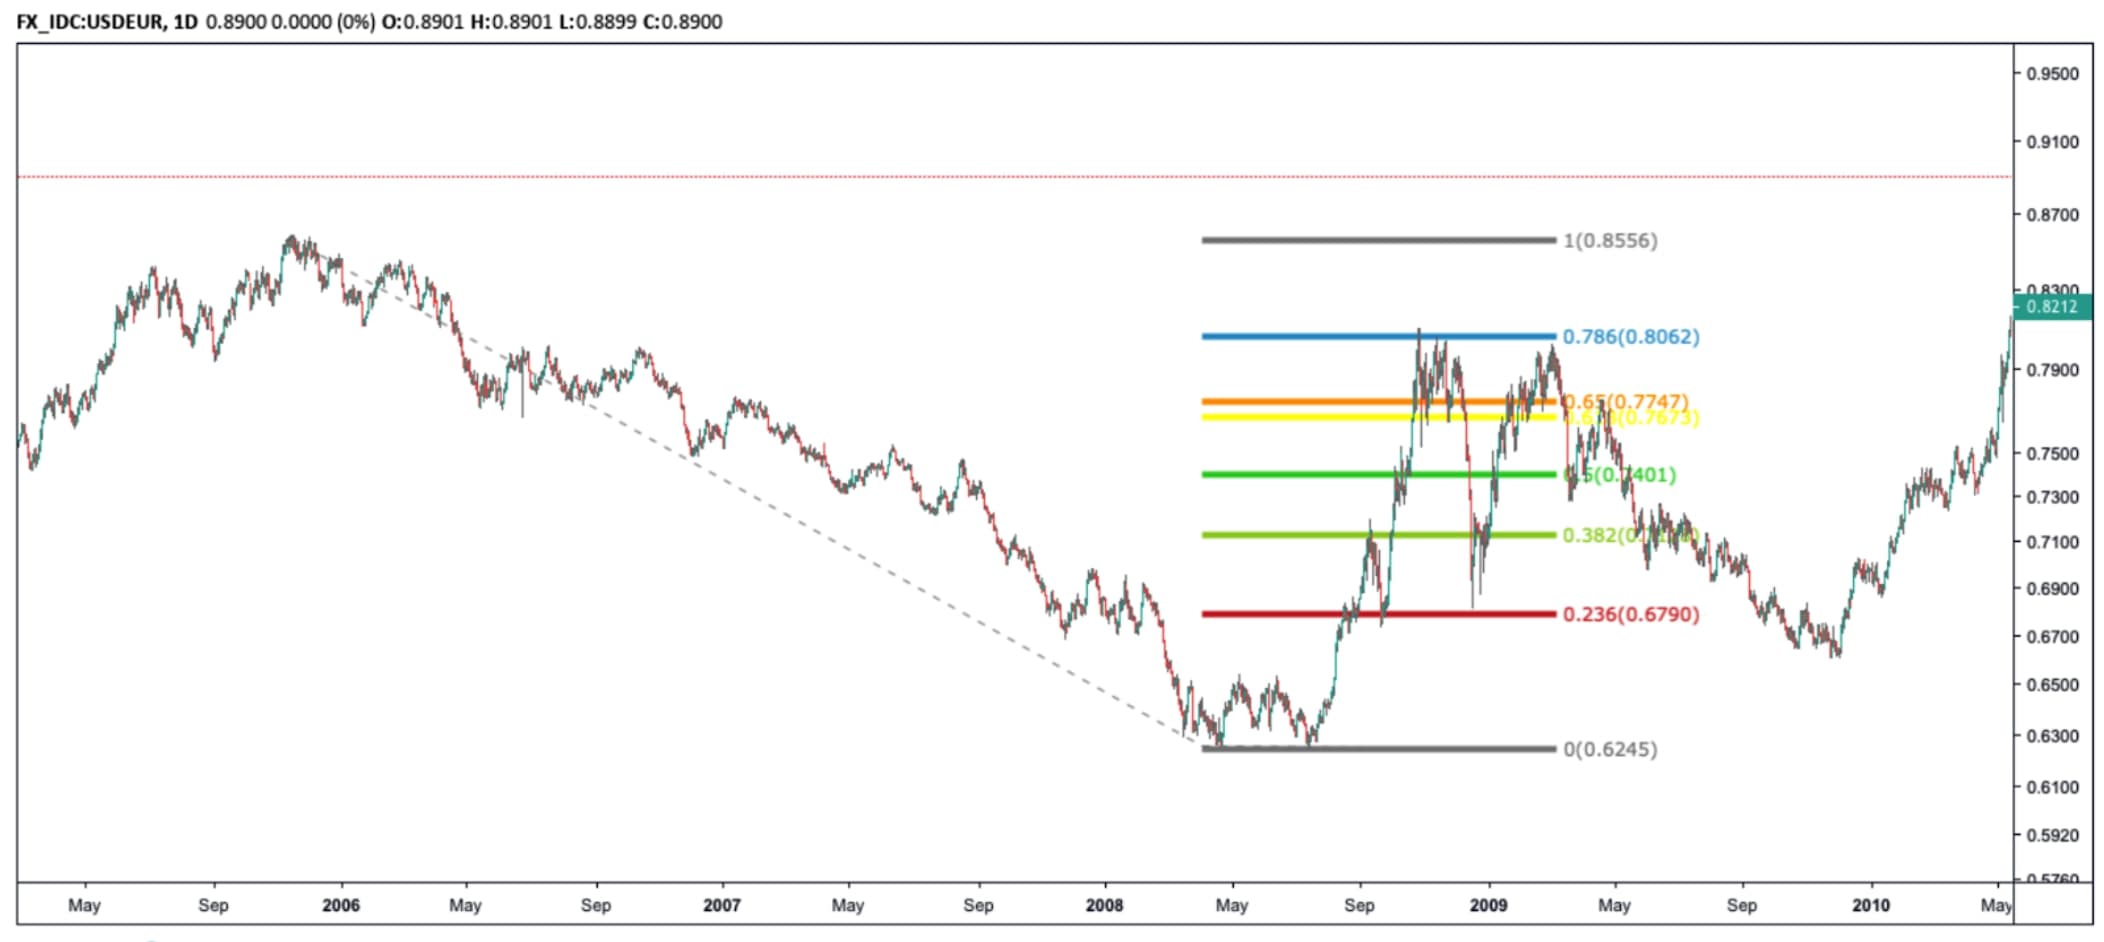
To conclude, the golden pocket between 0.65 and 0.68 are the levels where a price reversal (short-term) is most likely happening and the 0.382 fib level is also a very strong trend reversal level.
However, that’s only true if we assume a price reversal at all. Thus, both tools can be used to either identify supports or resistances, making sure we find good entry and exit points.
