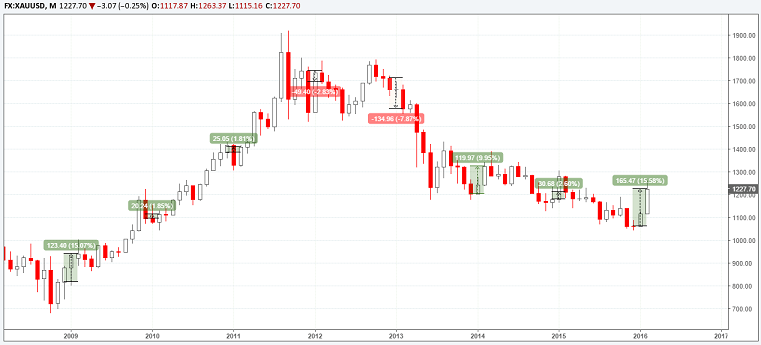
Gold, the precious metal that was shunned in the past few years staged an impressive rally since late December, with momentum picking up in mid January this year. While losing over 10% in 2014, Gold prices are already up 15.5% since January 2015, breaking above the psychological $1200 an ounce price level as well, which begs the question if Gold is seeing a mere seasonality bounce or if there are more serious underlying forces at play.
Gold – A look at seasonality
In order understand the current rally in Gold, taking a look at the seasonal trends in the precious metal is a good place to start. The metals and mining sector at large and especially Gold tends to start a rally around November peaking towards mid-February with the end of year holiday season seeing a lot of shoppers, especially in China and India buying Gold. The precious metal then tends to gradually ease by into March followed by another small rally before starting to decline by end of March through June followed by a seasonal decline into August/September.
The chart below, from Seasonalcharts.com shows a 30 year seasonal trend in Gold, which depicts the seasonal peak in the first few months of the year.
Gold 30 year seasonality (source: seasonalcharts.com)
The rally in Gold especially since late December has been impressive but shouldn’t come as a surprise for chartists. The next chart below shows the December – February rally. Although not as impressive as this time, the recent seasonality shows the tendency for Gold to rally into the first months of the year.
Gold – Recent seasonality
Monetary Policy – US Interest Rates
Besides the seasonality, another factor at play was that of the US Federal Reserve which hiked rates in December by 25bps. Traditionally, Gold is often used as a hedge against inflation and in tighter monetary policy conditions; Gold tends to surge as interest rates move higher, tracking inflation. What adds to the complexity however is the fact that currently, the inflationary pressures seem to be somewhat limited. Adding further to this puzzle has been the Chinese equity market slump which soured investor sentiment strongly as a result sending Gold prices higher while equities plunged.
The Federal Reserve, in its January monetary policy meeting minutes noted that the rate hikes would be gradual and data dependent, contrary to the December meeting’s forecast which showed four rate hikes in 2016. However, it looks optimistic at this point in time to expect four rate hikes against the backdrop of weak investor sentiment and lack of inflation to support the idea.
Gold – Technical Outlook
With the above context in place, the technical chart for Gold paints a rather interesting picture when looking at the next 3 months horizon. The monthly chart for Gold shows the December monthly session closing out with a doji candlestick pattern, marking indecision which comes after a steady decline since early February of 2015. The December doji high of $1088.72 was broken with January’s session closing strongly higher. As the momentum built up, prices then surged higher in February and at the time of writing; Gold has retreated off the highs near $1263 following a test of the long term trend line.
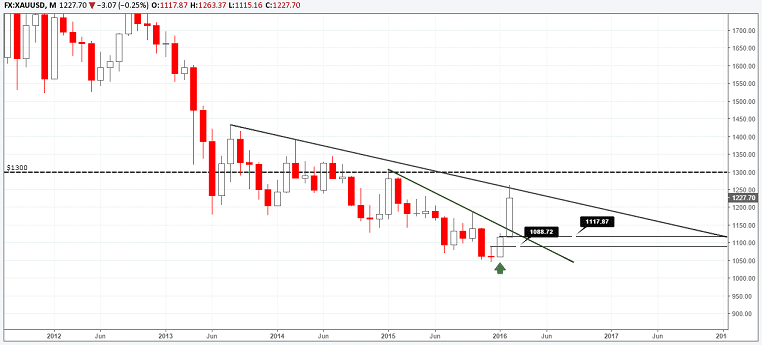
Gold – Monthly Chart (Trend line Resistance)
We anticipate a short term top coming in place at the moment and expect Gold prices to potentially pull back lower. To the downside, support at 1117 – 1088 will be key. Establishing support here could potentially mark another attempt to break higher opening the gates for a test to $1300.
In the near term (2 – 4 weeks), we can expect Gold prices to possibly retreat lower in order to find support in anticipation of another push higher. 1117 – 1088 will be a key price level to watch in this aspect. And in the run up higher off 1117 – 1088 support, 1240 resistance will play a key role. Only a break above 1240 will see a test to $1300.
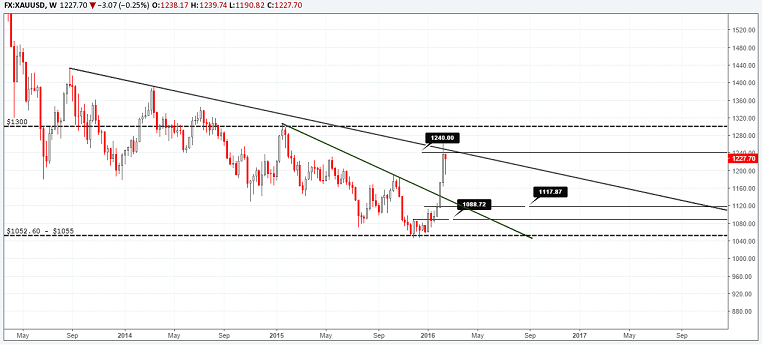 Gold – Weekly Chart
To the downside, a break below 1088 could see the support level give way for Gold to test the previous lows at 1052.60 – 1055 followed by a test to the lower round number at $1000.
US monetary policy, investor sentiment and inflation will be the three key themes to watch for going forward.
For traders, going long on Gold at the current levels would be a risky bet as price trades near a key resistance level. Watch for pullbacks here on forward to the $1240 levels, against a longer term decline to $1088.
Guest post by Andreas Pavli of http://www.allfxbrokers.com
