October 2017 – The Informed Trader
Dear Reader,
This is part one of the first issue of the monthly newsletter “The Informed Trader”. I, Wian Stipp, am the head technical analyst at “4xTrading.co.uk”, a trading school with plenty of free resources. I want to thank Forex Crunch for giving me the opportunity to post on their site. In these newsletters, I try to find major junctures in markets to look for huge profit opportunities. I hope you enjoy and if you have any questions/comments then please let me know.
The full issue will be released at the end of each month.
The Crude Oil Market (West Texas Intermediate)
September was a good month for crude oil, but will this optimism continue going into late October / early November? Well, we’re not convinced. Of course, there are numerous possible outcomes and paths the market could take at this point, however, in the short term a move down below $42.00 is preferred. Let’s look at the monthly chart and see what we’re dealing with.
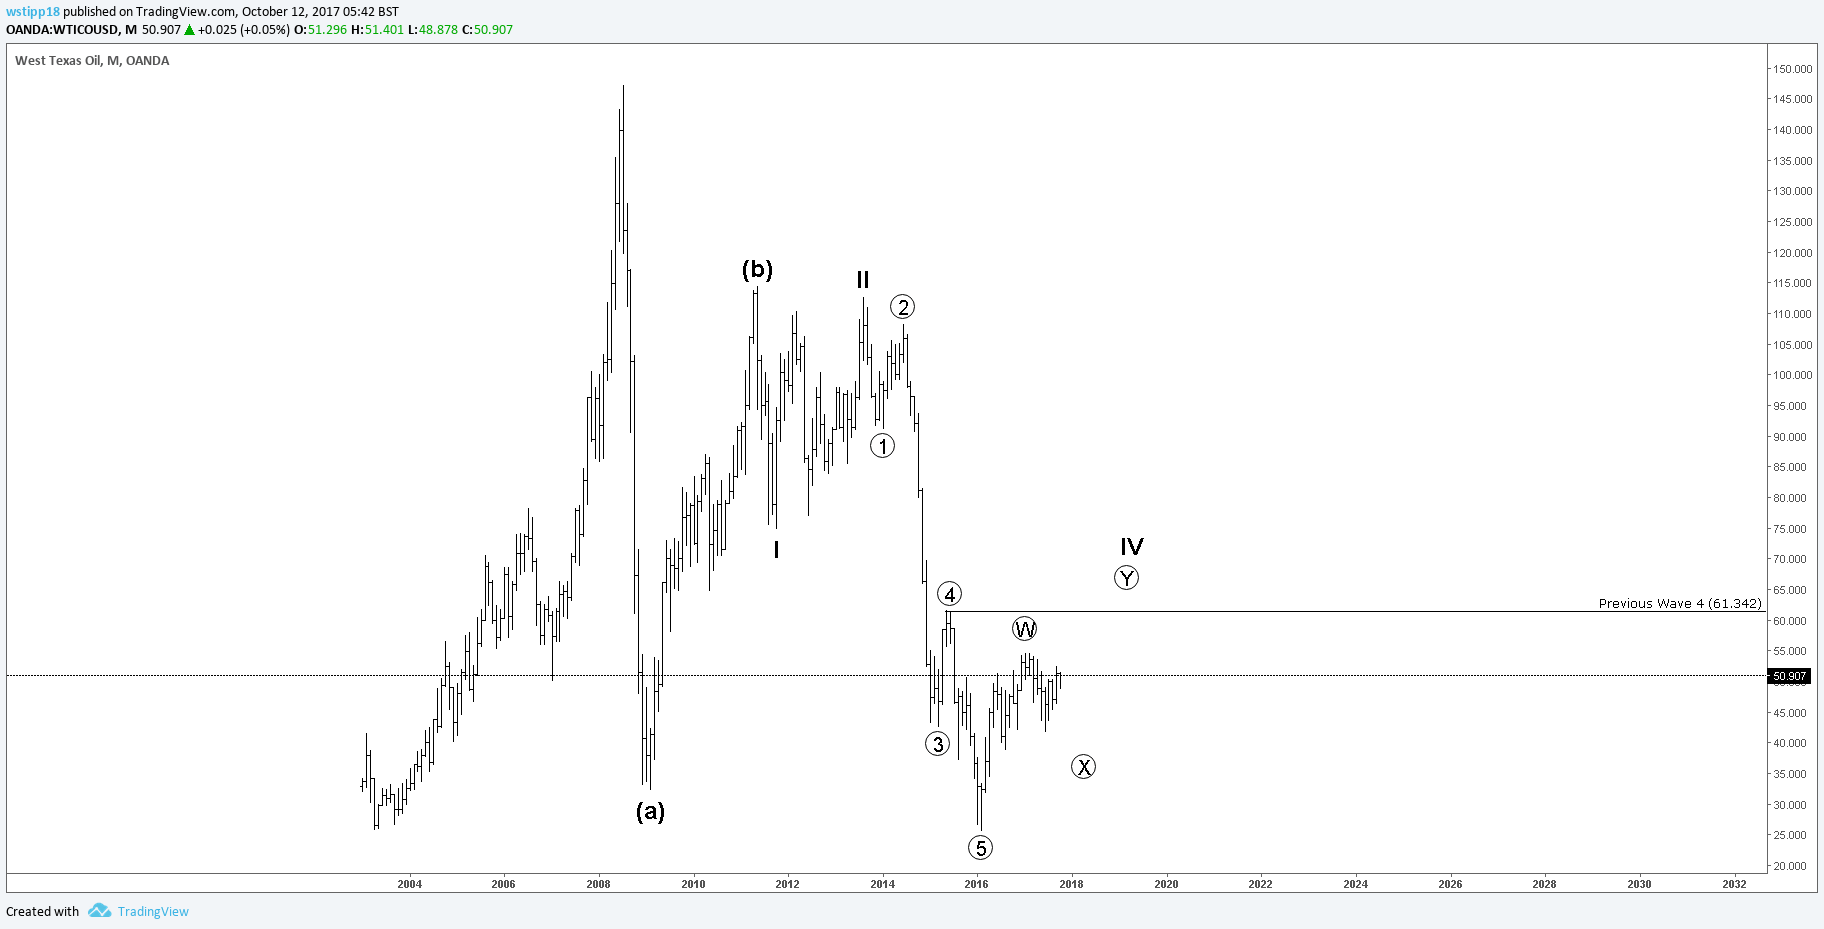
LONG TERM ELLIOTT WAVE CHART FOR CRUDE OIL
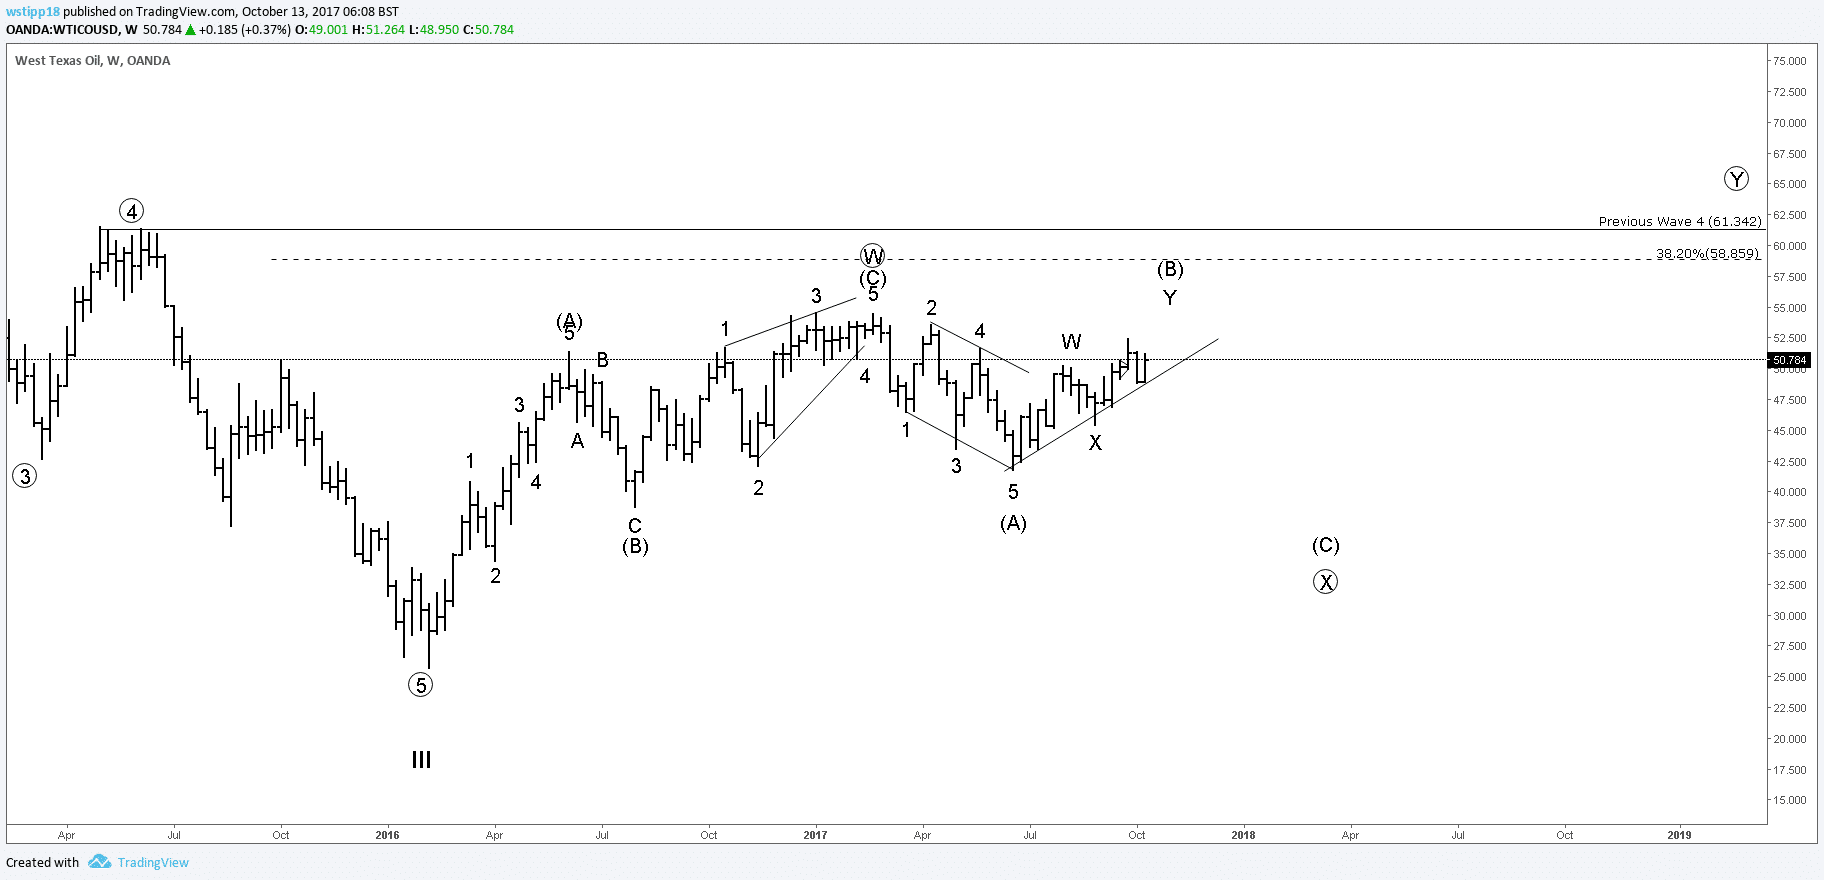
The current view we have is that we’re currently in a ‘3 wave correction’ from the July 2008 high at $145.31. Crude Oil is currently in ‘wave (c)’, which is very likely to be the final wave before a huge rally. ‘Wave (c)’ progresses in 5 waves, of which it is currently completing ‘wave IV‘. Although there is a 3 wave move from the low ((5)), we are expecting more correction and for a ‘W-X-Y’ pattern to be generated because we hope for a visual time similarity between ‘wave II and IV’ of the same degree. A weekly chart is better to show the expected wave patterns within the ‘((X)) wave’.
Now, if we look at the ‘(B) Wave’ Oil is currently in, there may have already been a “3 wave correction” after a “5 wave expanding leading diagonal” for (A). If so, we can expect 5 aggressive waves down below $41.70 and probably as low as $39.8. This may seem like a large move, and it is, but with the current patterns in the chart this is looking reasonably likely. However, it is more likely that there could be one more temporary high above $52.50. The daily chart will show the reasoning behind this in greater detail.
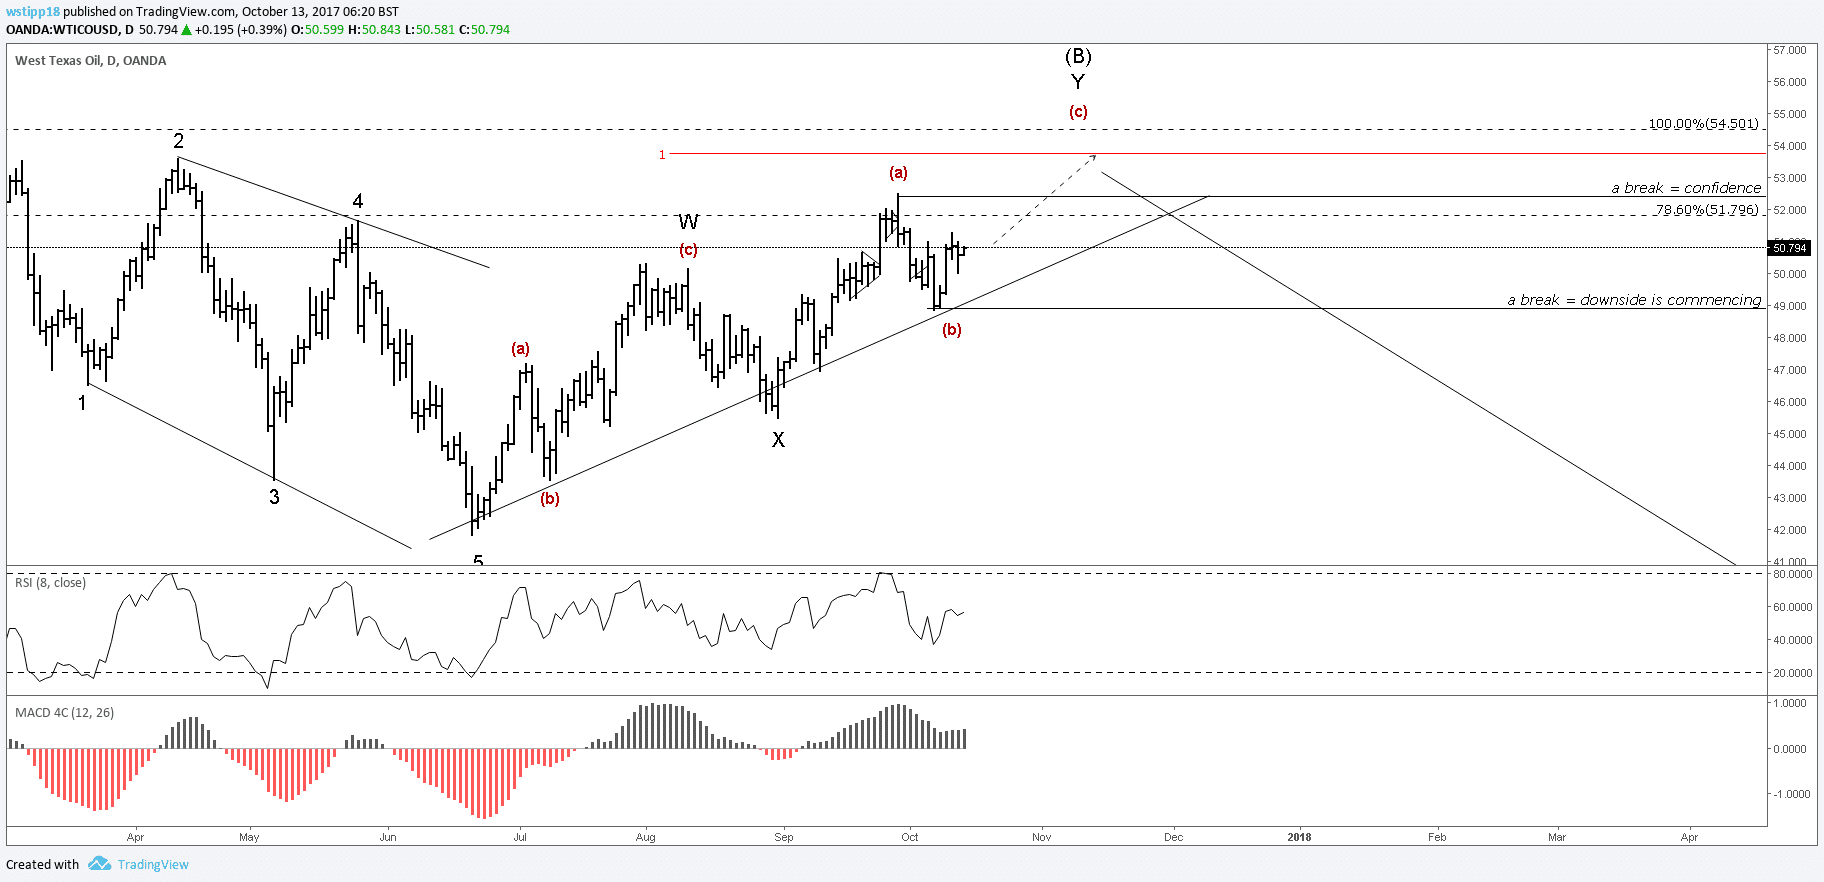
Following this wave count, another high is expected to come in to complete the ‘W-X-Y’ pattern. If there is a break of the trend-line connecting the start of W and the end of X, one can expect the pattern to have already completed meaning the decline will take place immediately. We must be careful because this ‘(B) wave’ is becoming a very deep retracement of (A). If there is a break of $54.50, then we can discard this particular count and reconsider. If Oil does manage to squeeze out one more high above (a), then there will be a significant divergence on RSI and MACD. This will increase confidence for our count provided the high isn’t broken.
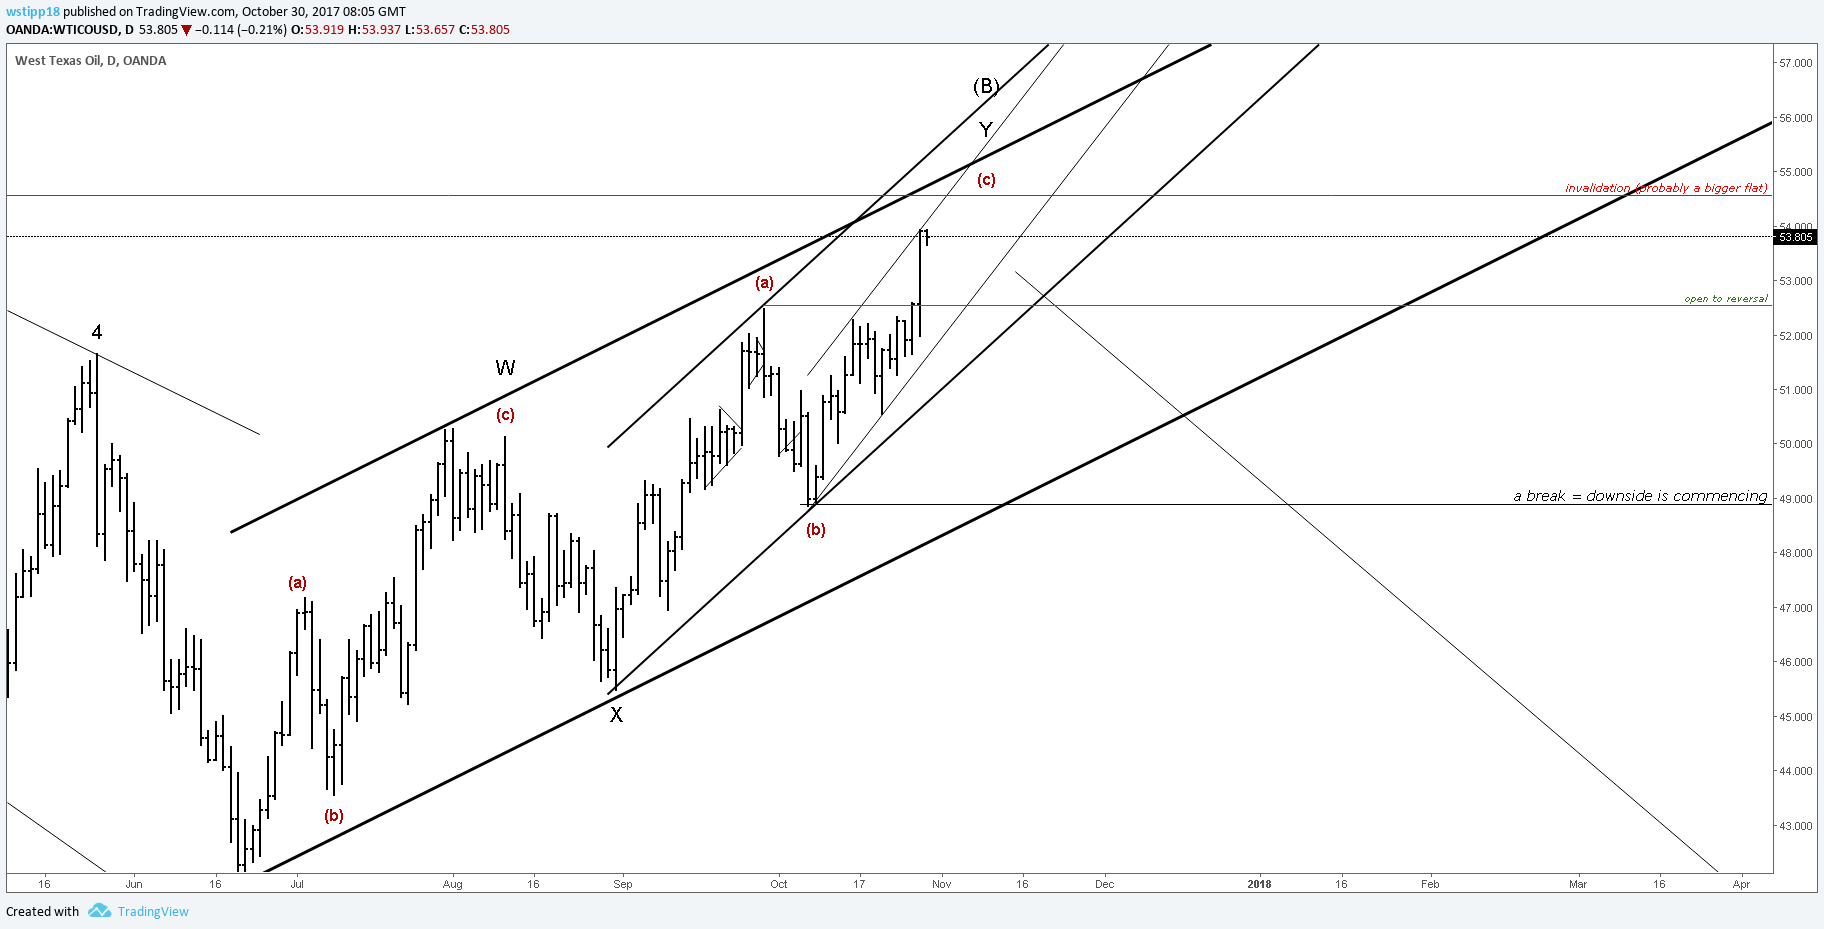
If there is going to be one more high in Crude Oil, then the next move up will have to penetrate the upper trend-line of the current channel (the thin black channel price is currently in). If it doesn’t do so, then it is more likely that price is actually corrective and is ready to decline from here. The horizontal green line indicates price being open to reversal because breaking it suggests another 3 wave move up is complete. If price breaks through the bottom of the channel, then we can expect a down move that would test the other two channels. Breaking these channels would be very significant for the short-term bearish case and the move to $40 would be extremely likely from there. This channeling technique is known as the Kennedy Channel and was developed by Jeff Kennedy, one of the authors of “The Visual Guide to Elliott Wave Trading” which is one of the best books regarding practical wave trading. I would recommend you get this book as it completely changed the way I looked at markets and traded at the earlier stages of my Elliott wave career.
If the high at (W) is broken, then a move to the downside is still reasonably likely. The reason being is that (W) completed as a zigzag and therefore we can expect (Y) to be a flat pattern. This is known as the guideline of “alternation”. Keep in mind this is a guideline and not a rule.
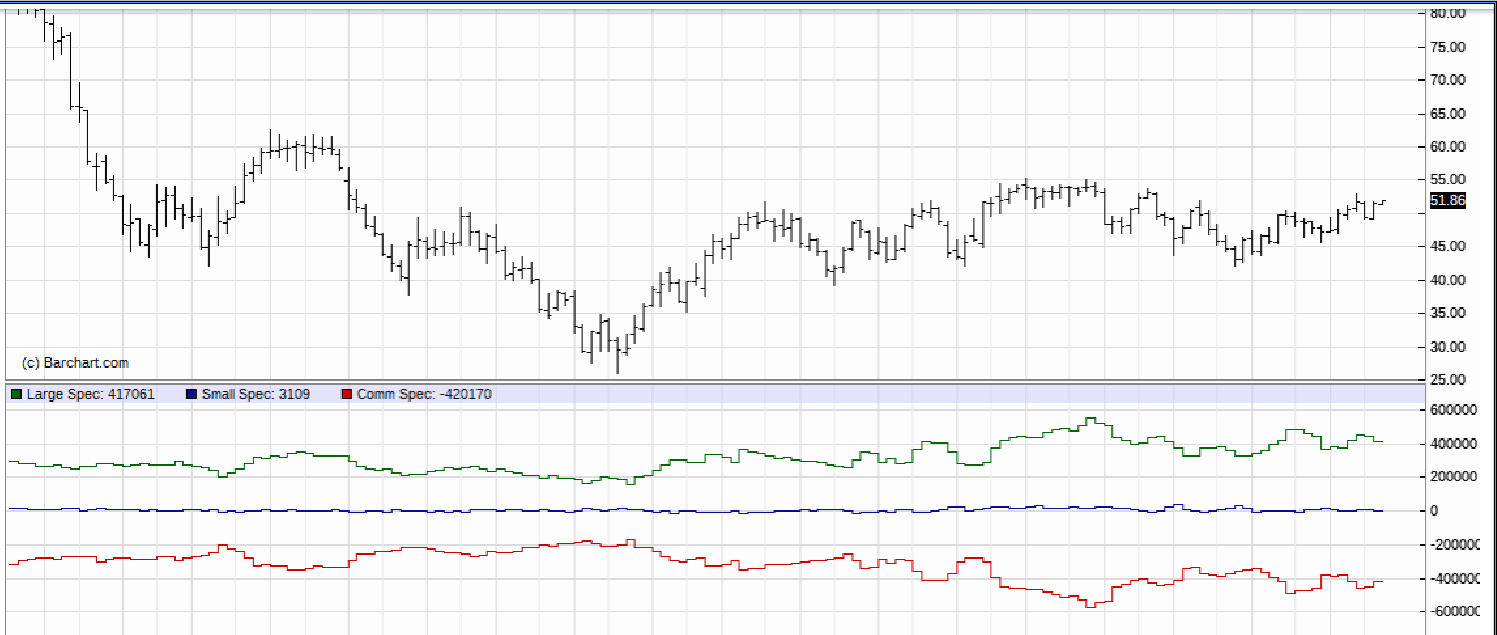
COT (Commitment Of Traders) data is showing Commercial Speculators are near the bearish extremes, however not at a peak. This does indicate downward strength but it’s unlikely that the February high is the final high for Crude Oil, which is exactly what the wave count is telling us.
In conclusion, Oil is bearish in the short term, but we want to see one more small high to complete the W-X-Y pattern before really selling into it. In the meantime, it isn’t a bad idea to buy until this pattern is complete. This should only be done by experienced traders that know how to read wave structure as it could turn at any point.
Wian Stipp – head analyst at: www.4xTrading.co.uk – trading education & analysis
