The recently volatility surrounding the Nikkei has been match by the yen and its surprising climb prior to the weekend. The rise in yields on the long end of the Japanese curve is creating a headwind for the BOJ. Despite a holiday in the US on Monday (Memorial Day), the Nikkei declined 3.5% only to bounce back on Tuesday generating significant market volatility.
Unwanted volatility in the USD/JPY and JGB’s has pushed the Nikkei down almost 10% from its peak. Appreciation pressure on the yen could be a function of unwinding of short yen hedges by equity investors, as the currency gains strength. Many of the foreign investors who have added nearly $80 billion into Japanese equities in 2013 have hedged their currency exposure by shorting the yen. The decline of the Japanese equity bourses could have placed them in a position where they are over-hedged and could lose additional capital if they do not unwind their hedge.
Guest post by Marcus Holland of forexbonus.co.uk
The surge in Japanese Government Bond yields was a topic discussed during the late April BOJ policy meeting as observed in the BOJ meeting minutes. Governors thought bond markets could become unstable, and disrupted economic growth. The volatility in the capital markets has hampered Prime Minister Abe’s approval rating which dropped to 68% during April. Despite the rally and decline in the Japanese equity markets only 22% of those surveyed believe the currency policy is improving the Japanese economy.
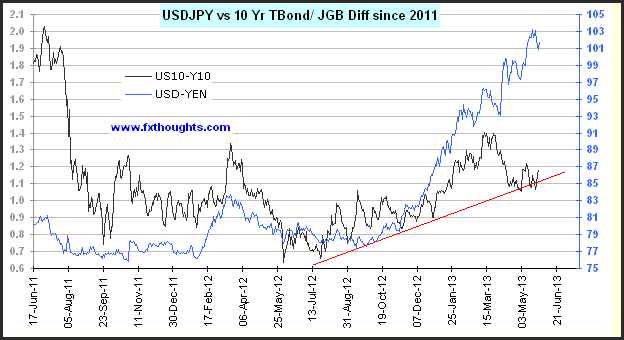
The efforts by the BOJ has pushed the yield differential between US and Japanese government 10-year bonds in favor of the US over the past few trading sessions. Despite these efforts the currency pair has been under pressure, and has remained volatile. The yield differential between the US 10-year and JGB’s has moved above 86 basis points and is likely to test recent resistance levels near 88 basis points. The yield differential was able to hold support reflected by an upward sloping trend line near 84 basis points.
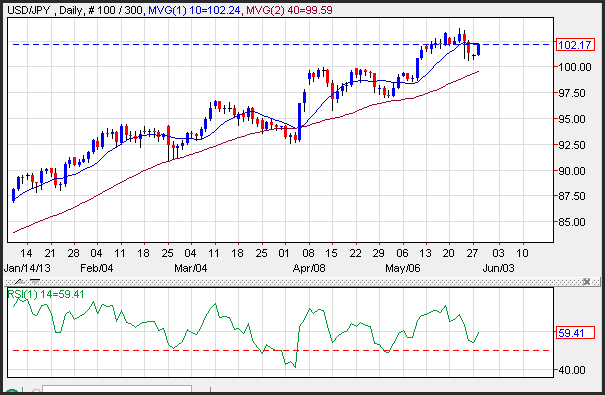
The USD/JPY currency pair moved higher during Tuesday’s trading session running into resistance near the 10-day moving average at 102.17. A daily close above this level would likely generate a test of the recent highs on USD/JPY at 103.75. Support on the currency pair is seen near the recent lows at 100.70, and then the 40-day moving average at 99.59.
The oscillation of the currency pair is steady with momentum moving higher as reflected by the RSI (relative strength index). The RSI bottomed along with the currency pair and is printing near 60 which is on the higher end of the neutral range. The higher low on the RSI compared to the April lows shows that the uptrend is still in place. A print above the 70 level on the RSI would reflect an overbought condition which would be a warning sign that the USD/JPY is too frothy.
