When I started trading, I had no clue about the fact that traders could trade on different time frames. In fact, I thought a successful trader had to be constant and keep his eyes focused on one single time frame.
Later on, I came across the idea of using more than one time frame to trade. That sounded very complicated and I didn’t want to give much thought to it. I believed multi-time frame analysis involved looking at a lot of different things and I was slightly scared of getting confused. I preferred to keep things simple.
Over time, however, I began to look at multiple chart time frames by curiosity and became fascinated.
A chart is like a book. When you open a chart, you get to read a story, characterized by up, down, and sideways movements. You can either look at the whole book and make your mind from It, or you can open the book to read the story.
The fascinating part of trading is that you can, at any time, break down any chart to see what is truly happening in the moment.
Whether you become convinced of incorporating multi-time frame analysis or not, I want to provide you with a very simplistic way of looking at the market through multiple time frames.
The Basis Of Multi-Time Frame Analysis
In any market, the big picture usually drives what happens on lower time frames. As a result, the goal of multi-time frame analysis is going to be starting from the book cover (higher time frame) to go to individual pages or lines (lower time frame). That lower time frame will be used to trade.
I want to ke4ep this article practical so I’ll show you an example. Not long before the publication of this article, the AUD/JPY was about to reach a major resistance zone on the daily chart:
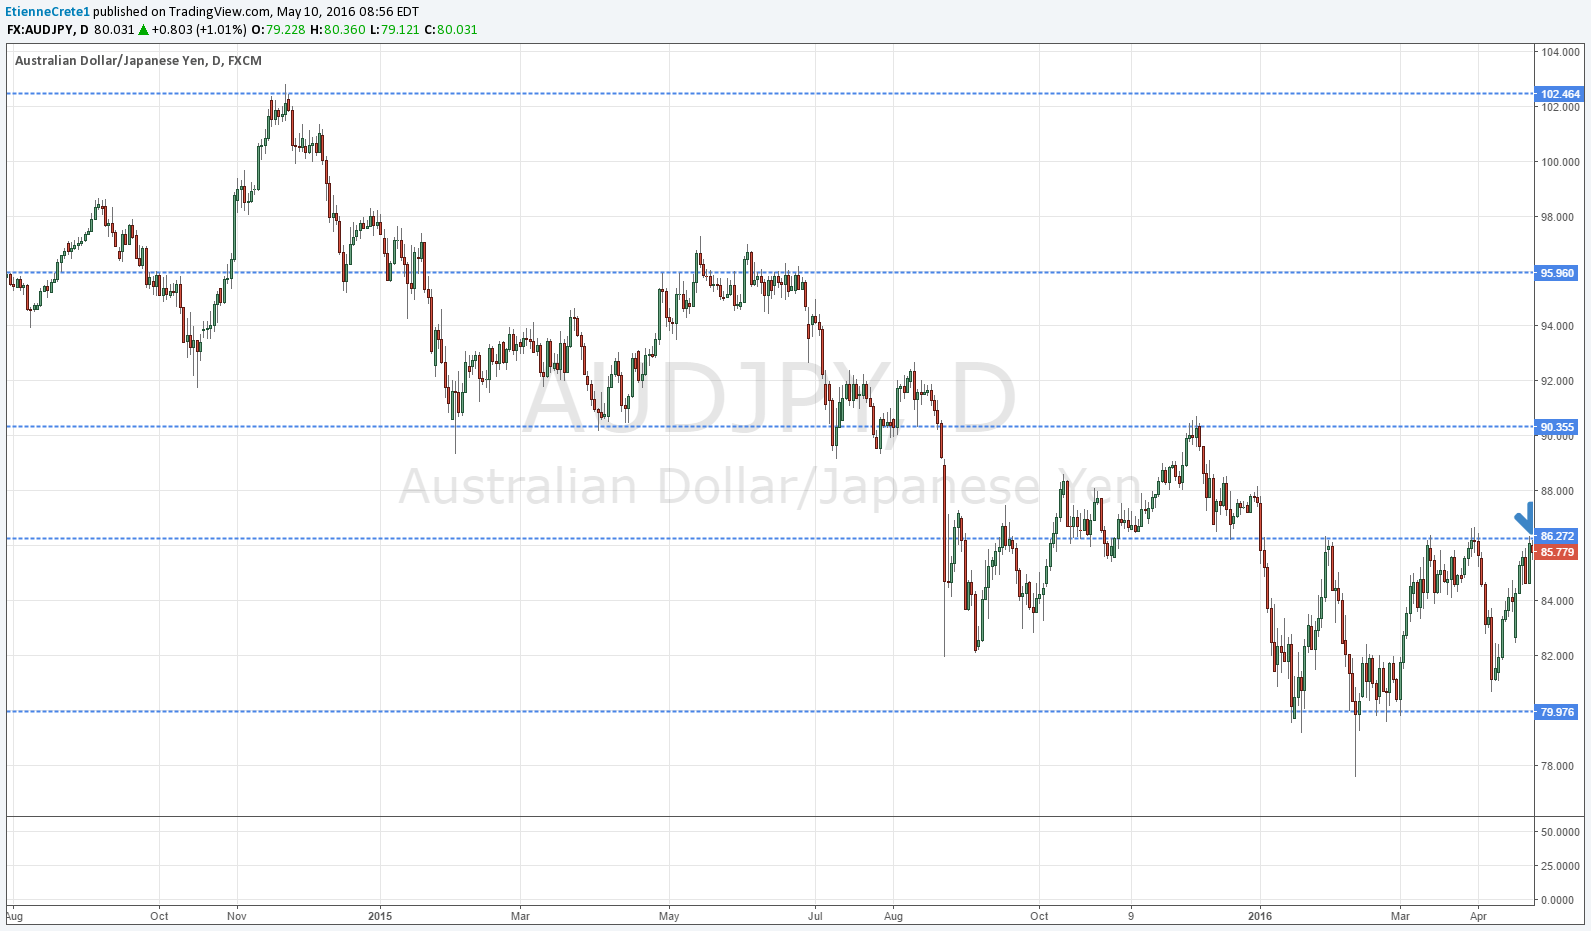
Most traders would look at that chart and wait for a bearish sign before entering any trade.
However, a multi-time frame trader might ask himself “what’s the story inside that daily chart candle right now?” He would then go to a lower time frame to see how the price behaves.
Here’s the 1 hour chart:
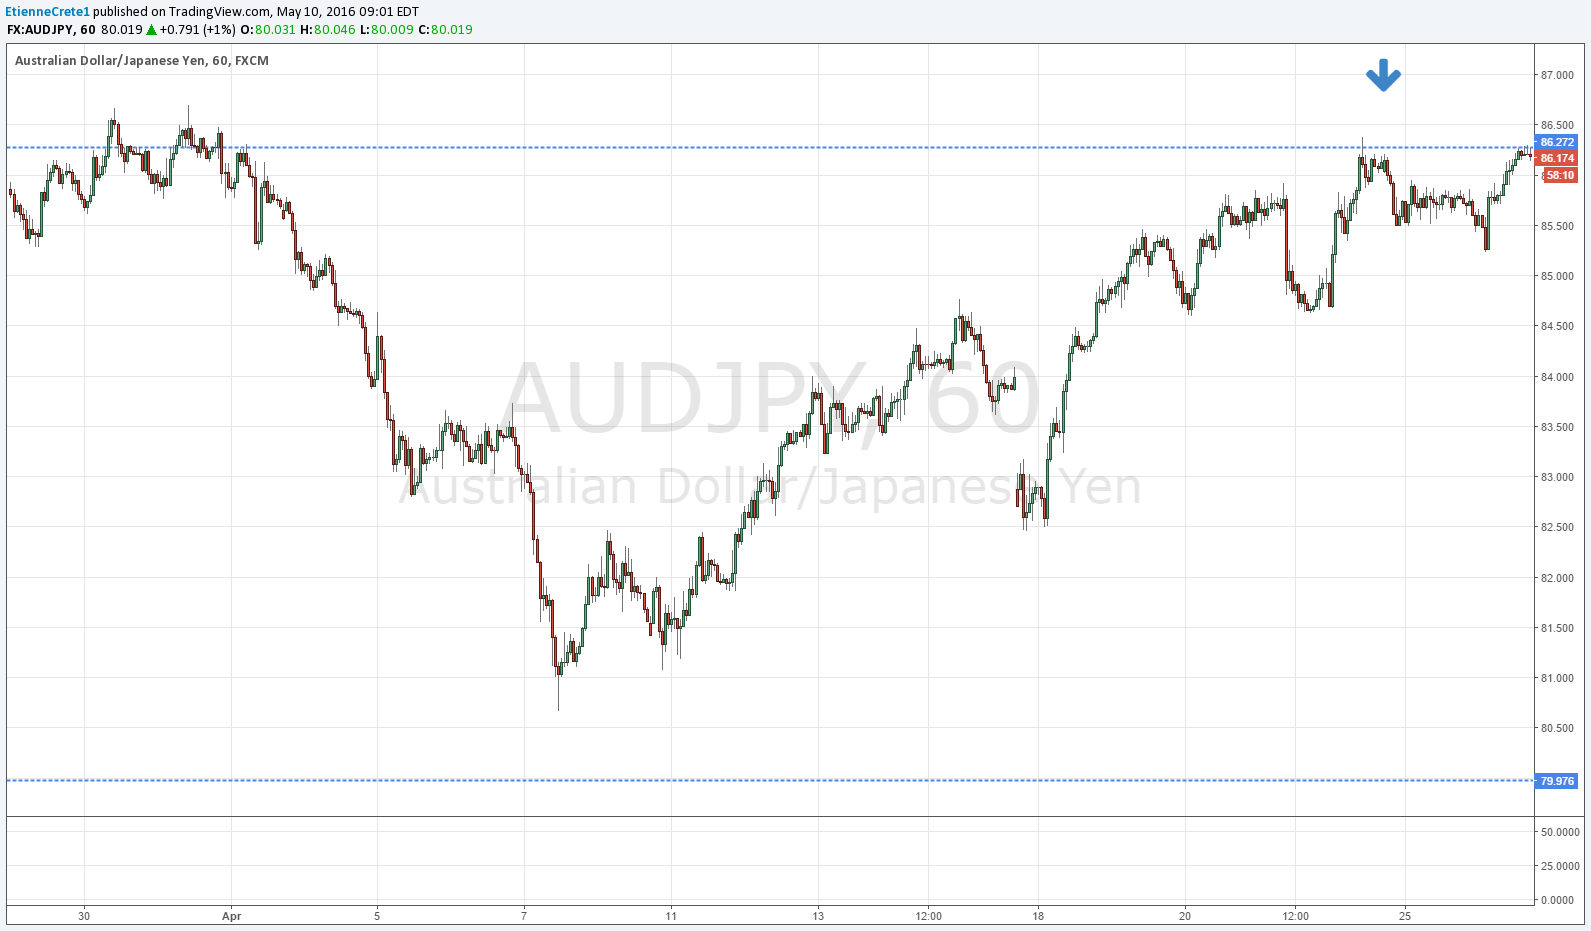
The chart above is like an actual page of a book. It’s more specific. The question to ask now is “What happens at this critical zone?”
In my experience, it is very rare that the exchange rate reverses without a short consolidation. I would therefore be interested in seeing a consolidation to the resistance level. This is exactly what we see:
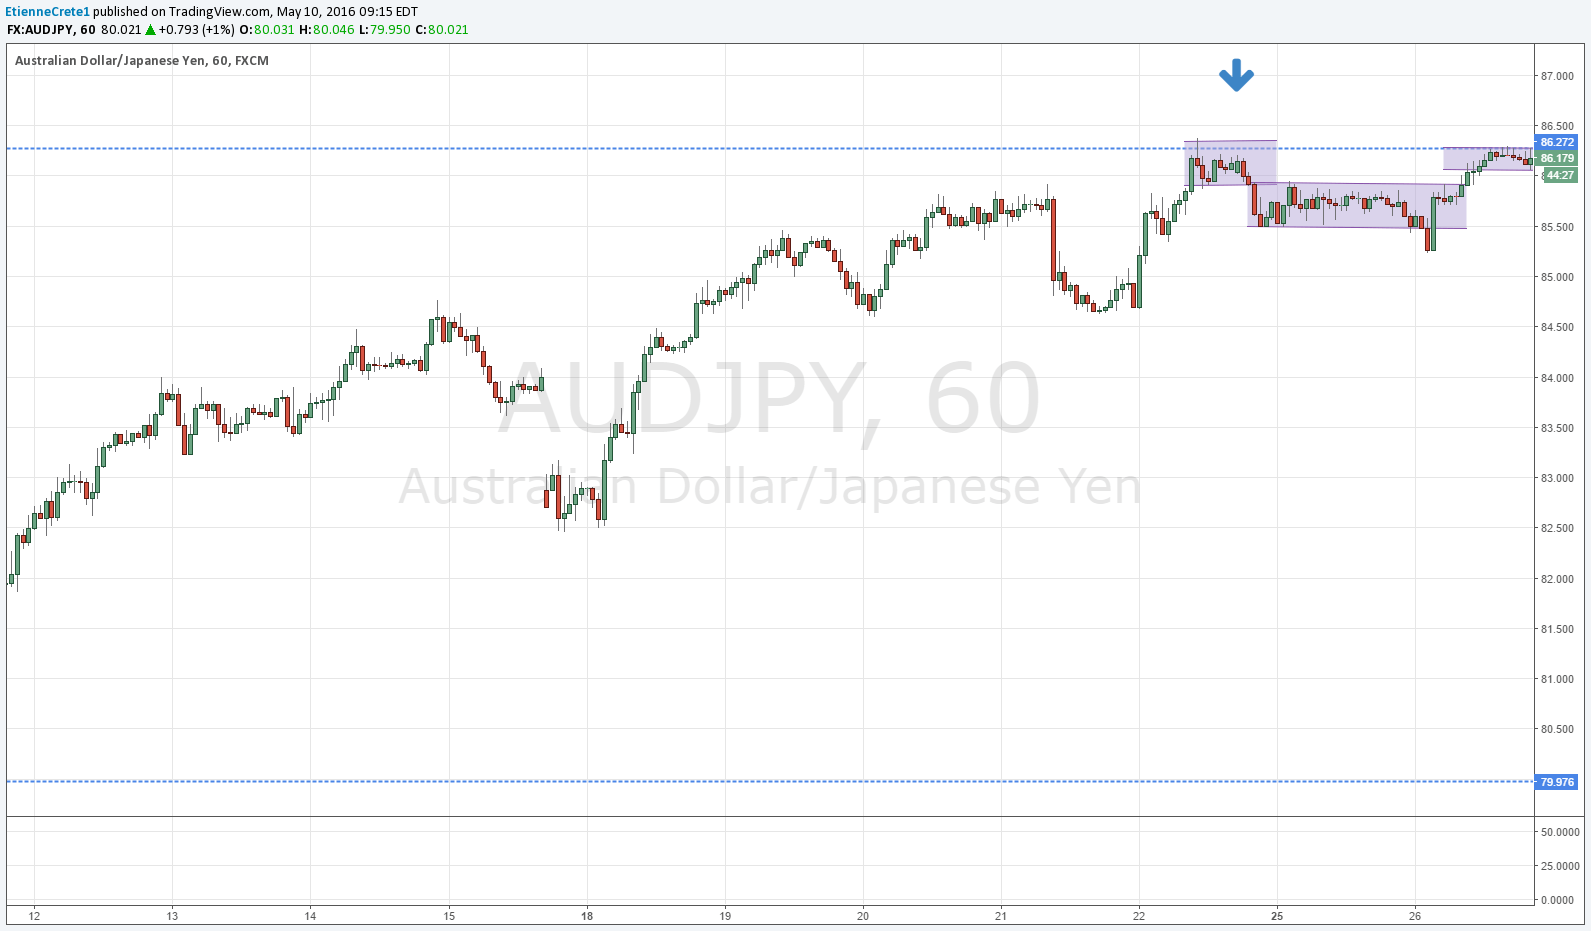
At this point a breakdown from those brief consolidations constitutes a good way to enter a short trade. A breakdown trade is entered below the low of a consolidation. Many trades were possible on the chart above. Eventually, the price has come down significantly.
That being said, you should always have a stop loss (above the recent high).
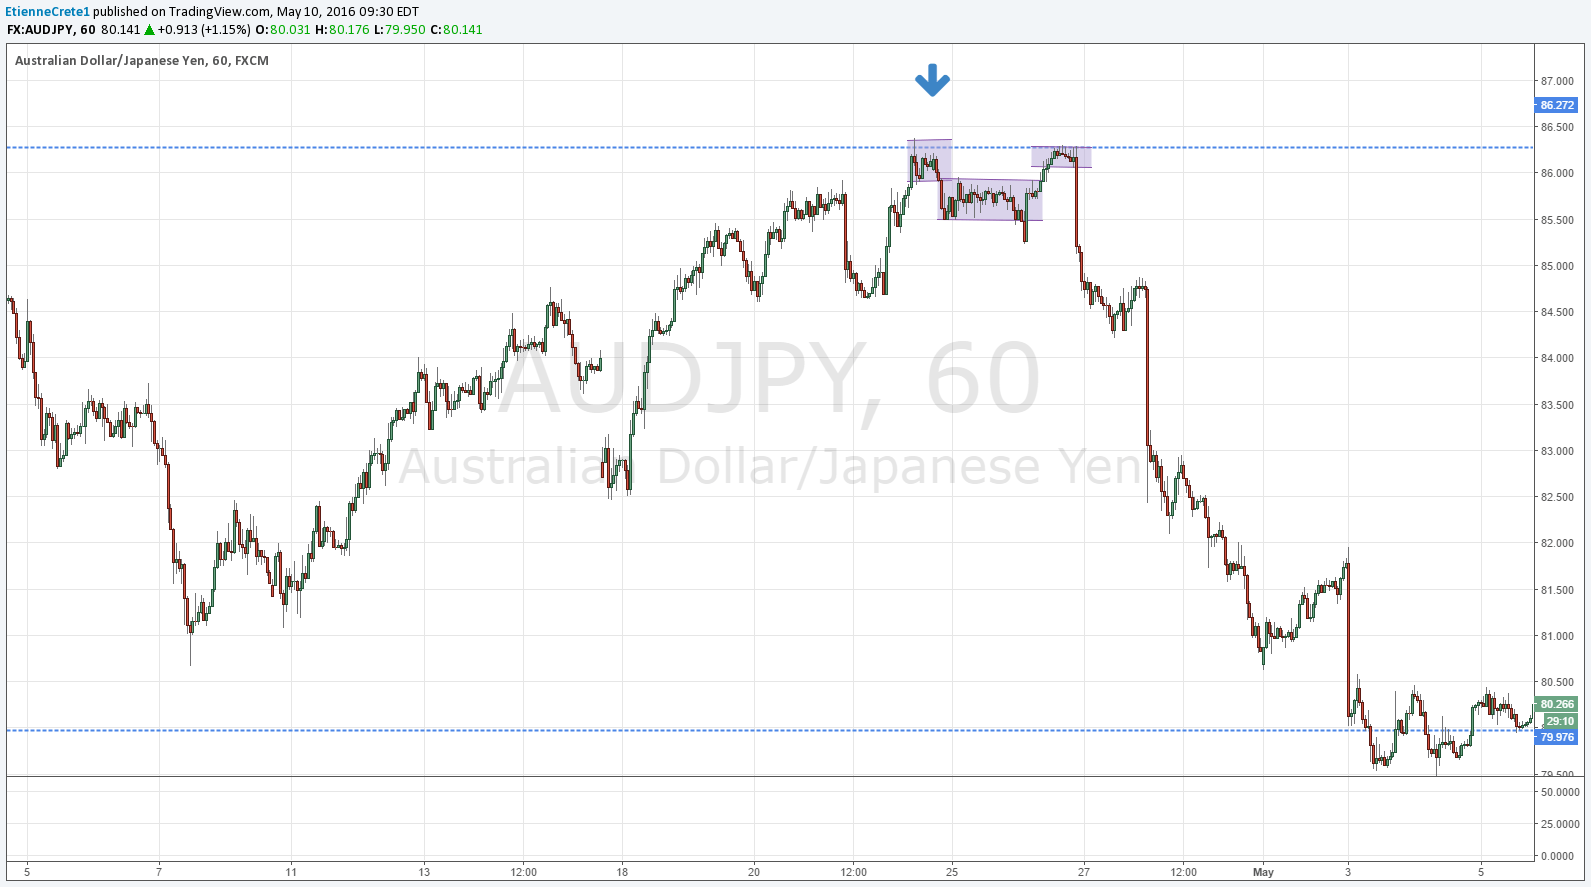
My personal way of doing things is to set a first take profit with a Reward-To-Risk of 1 and a more ambitious second take profit.
The Benefits
Trading based on multi-time frames as described above has a few key advantages.
First, traders using this approach usually experience a higher win rate than those using one time frame only. That is due to the fact that the higher time frame brings a bias to where the market is likely to go.
Second, the rewards (for winning trades) are usually bigger. That, of course, is given the fact that traders take at least part of their profit based on the higher time frame.
Conclusion
Multi-time frame analysis may not fit your trading style. I try to give it a very simplistic approach because the important aspect of it is to understand what is happening in the market. This doesn’t have to be made more complicated.
When you keep that approach of starting from the book to go to a specific page, you’ll see that the price of a certain currency pair often behaves in very similar ways once it reaches a support or resistance area.
Using multi-time frame analysis is a great way of combining the love for trading lower time frames to the stability of the big picture.
Have you ever used multi-time frame analysis? How was it? Leave a comment below!
Guest post by Etienne Crete of DesireToTRADE
