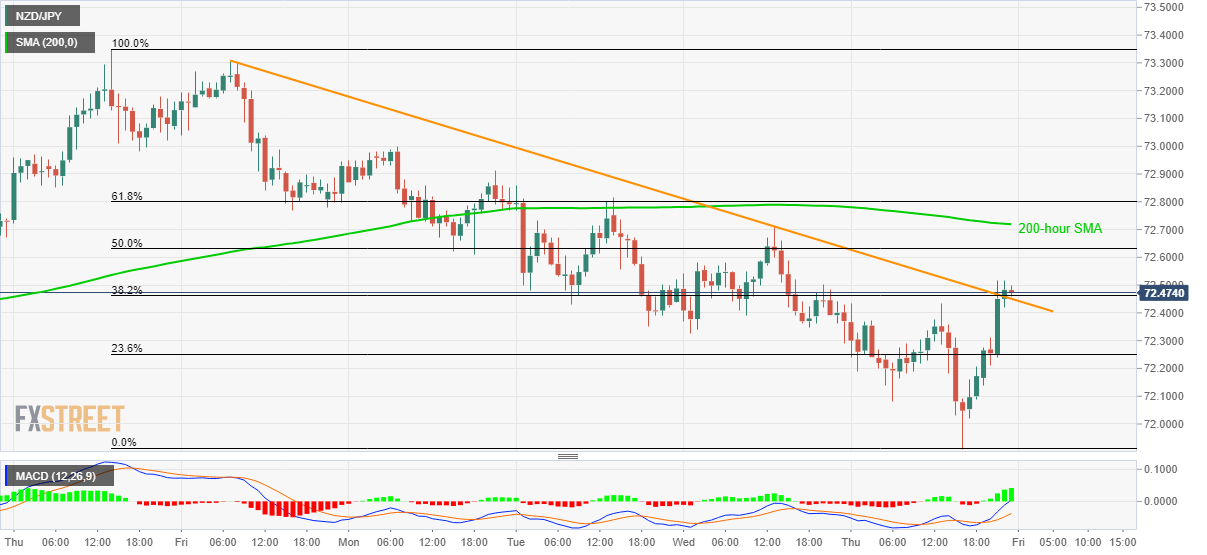
- NZD/JPY trades near two-day high after New Zealand’s Q4 CPI rose beyond expectations.
- The pair now heads to 200-hour SMA.
- 23.6% of Fibonacci retracement can offer immediate support.
NZD/JPY takes the bids to 72.50 during early Friday morning in Asia. In doing so, the pair crosses a one-week-old falling resistance line. The buyers seem to cheer upbeat data from New Zealand while portraying the recent run-up.
Read: Breaking: New Zealand Q4 CPI: YoY 1.9% / QoQ 0.5% (NZD bullish)
A 200-hour SMA level of 72.72 is a nearby upside barrier that the bulls are currently targeting. Though, 61.8% Fibonacci retracement of the pair’s declines from January 16 to 23, at 72.80, could restrict the pair’s further advances.
In a case where the NZD/JPY prices rally beyond 72.80, 73.00 can offer an intermediate halt to the rise targeting January 16 top surrounding 73.35.
Alternatively, pair’s downside break below 23.6% Fibonacci retracement level of 72.25 can recall Thursday’s low of 71.91 ahead of challenging the monthly bottom near 71.25.
NZD/JPY hourly chart
Trend: Bullish

