- NZD/USD becomes the bull’s favorite after bouncing off 0.6584.
- Normal RSI conditions, two-month-old support line favor the buyers.
- July month’s high becomes the key upside barrier.
NZD/USD takes the bids near 0.6610, up 0.34% on a day, amid early Tuesday’s trading. In doing so, the kiwi pair snaps the previous two days’ downside but stays below 21-day SMA immediate resistance.
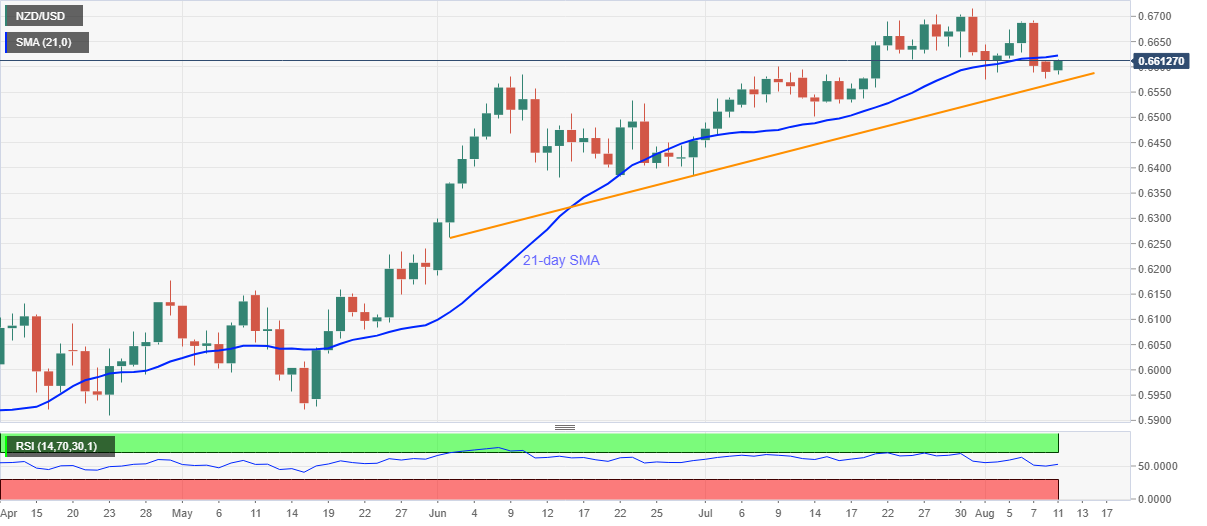
Other than the 21-day SMA level of 0.6625, the monthly top near 0.6690 and July 31 peak surrounding 0.6715/20 will also challenge the bulls during the pair’s further upside.
On the contrary, sellers will refrain from entries unless the quote drops below an ascending trend line from June 02, at 0.6570 now. Following that, June 23 high of 0.6534 will be on their radars.
If at all the NZD/USD prices stay weak below 0.6530, 0.6450 and June month’s bottom close to 0.6385 will return to the charts.
NZD/USD daily chart
Trend: Bullish
