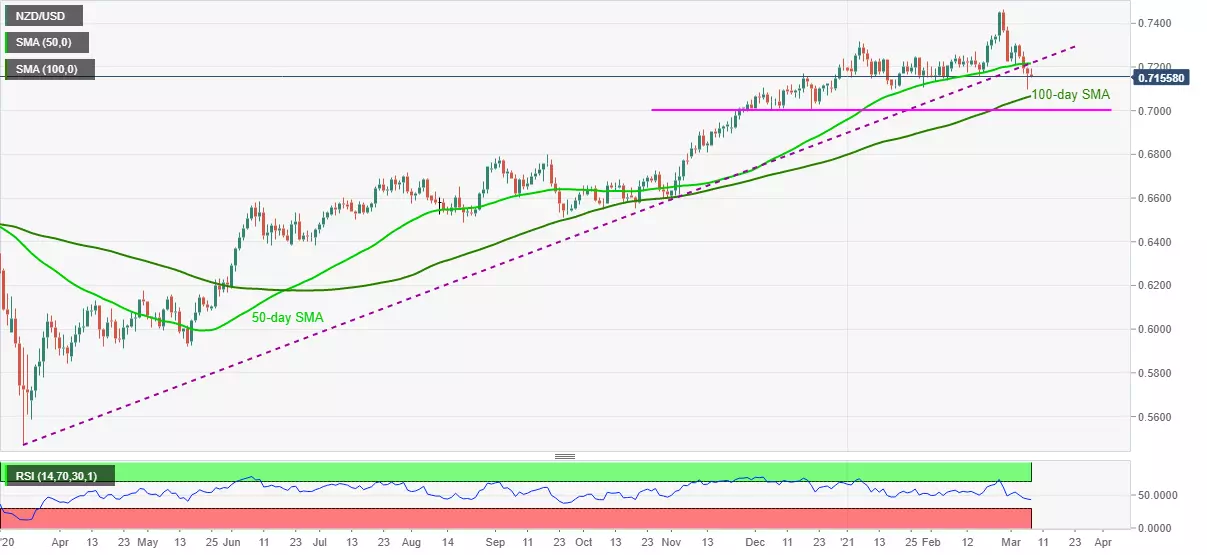
- NZD/USD stays depressed around yearly bottom, bears cheer earlier break of 50-day SMA, one-year-old ascending trend line.
- Falling RSI line, sustained break of key support confluence, now resistance, favor sellers.
- Monthly top, January’s high add to the upside filters.
NZD/USD refreshes intraday low while taking offers near 0.7150, down 0.23% intraday, during early Monday. In doing so, the kiwi pair extends last week’s break below 50-day SMA and an ascending trend line from March 2020.
Given the descending RSI line backing the downside move, NZD/USD sellers are on their way south to the 100-day SMA level of 0.7066.
It should, however, be noted that the quote’s further weakness past-100-day SMA will be questioned by a horizontal area around 0.7000 threshold comprising multiple levels marked since late-November 2020.
Meanwhile, corrective pullback needs to cross 0.7215 on a daily closing basis before eyeing the monthly top near 0.7310.
Also acting as an upside barrier is January’s high surrounding 0.7315, a break of which should recall the 0.7400 round-figure on the chart.
NZD/USD daily chart
Trend: Further weakness expected
