- NZD/USD fails to extend the previous day’s recovery moves.
- A horizontal resistance since December 05, 2019, adds to the upside barriers.
- 61.8% of Fibonacci retracement could offer strong support.
NZD/USD trades modestly changed near 0.6490 during early Wednesday. The pair recently took clues from China’s Caixin Services PMI while stepping back from Tuesday’s run-up. As a result, 200-day SMA continues to act as the immediate key resistance.
Read: China services PMI from Caixin/Markit: 51.8 (vs 52.5 Dec)
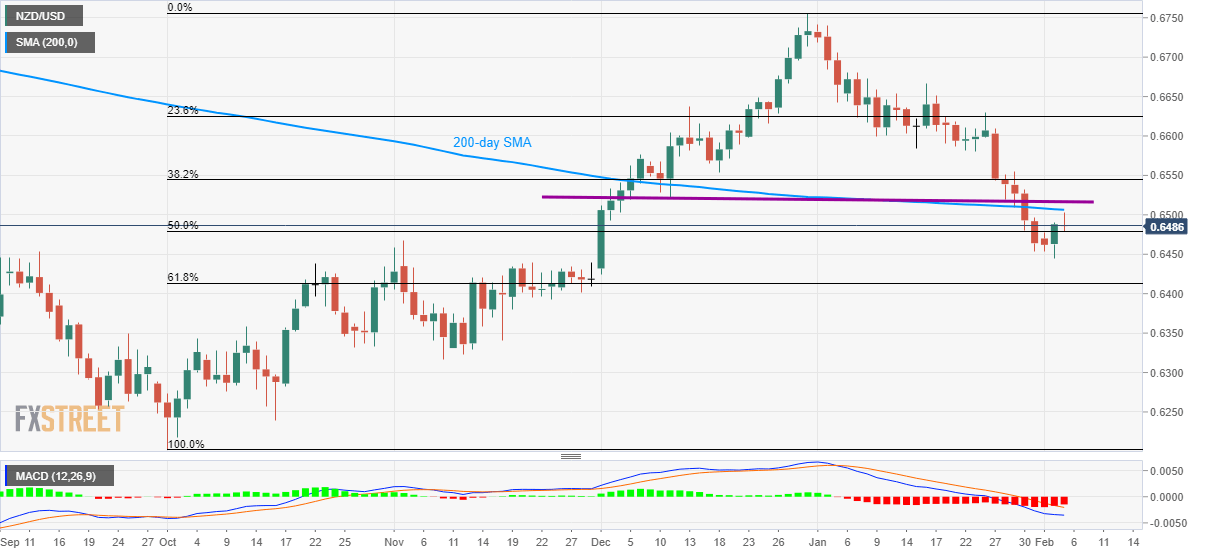
Not only a 200-day SMA level of 0.6505 but a horizontal region including lows marked between December 05, 2019, to January 28, 2020, also limit the quote’s near-term upside around 0.6520/25.
In a case where NZD/USD prices manage to cross 0.6525 upside barrier, January 23 low near 0.6580 could gain the buyers’ attention.
On the downside, the pair’s declines below Tuesday’s low of 0.6444 will drag it near to 61.8% Fibonacci retracement of October-December 2019 upside, at 0.6410. However, a 0.6400 round-figure could challenge the bears afterward.
It should, however, be noted that the pair’s sustained south-run beneath 0.6400 might not refrain to question November 2019 low near 0.6315.
NZD/USD daily chart
Trend: Pullback expected
