- NZD/USD remains below 61.8% Fibonacci retracement despite China CPI-led pullback.
- November 2019 low can please sellers while buyers will avoid entry below 200-day SMA.
NZD/USD pulls back from multi-week low to 0.6405 after China released January month inflation data on early Monday.
Read: Chinese CPI YoY (Jan): 5.4% vs 4.9% expected and 4.5% prior, (fastest rise since Oct 2011)
While better than forecast CPI and PPI readings triggered the quote’s bounce from the lowest since November 21, 2019, the quote still remains below the key resistances and remains on the bears’ radar.
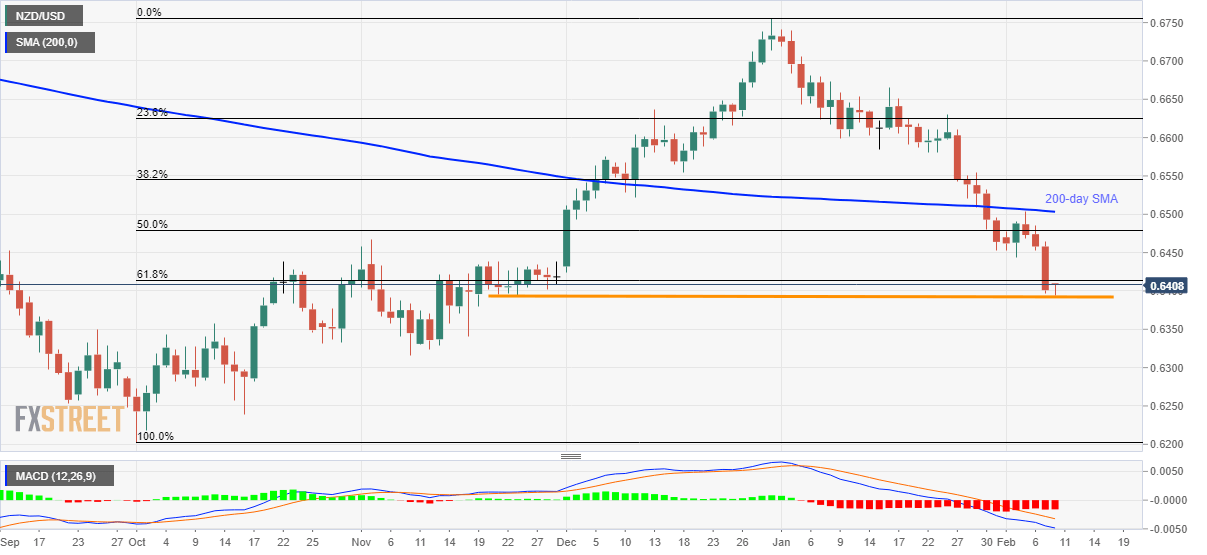
Among them, 61.8% Fibonacci retracement of October-December 2019 upside, at 0.6415, acts as the immediate upside barrier, a break of which could challenge January lows near 0.6455/50.
Even if the pair manage to cross 0.6455 on a daily closing basis, 50% Fibonacci retracement and 200-day SMA, around 0.6480 and 0.6505 respectively, will keep buyers in check.
Alternatively, the pair’s declines below 0.6400/0.6395 horizontal support can drag it towards November month bottom surrounding 0.6315.
Assuming the bear’s dominance past-0.6315, 0.6240 will offer an intermediate halt to the southward trajectory targeting the year 2019 low near 0.6200.
NZD/USD daily chart
Trend: Bearish
