- NZD/USD is on the watchlist for both a bullish and bearish prospect, depending on daily and weekly support.
- A break of weekly support opens risk for a significant pullback.
NZD/USD is trading on the backfoot due to dollar weakness and volatility on Wallstreet. However, the pair could be in for an extension to the upside so long as the current support holds the initial tests.
The following is a top-down analysis which illustrates that a break of daily support, then the monthly 38.2% Fibonacci retracement level will be in focus which will match the COT data’s reduction in long positioning.
Monthly chart
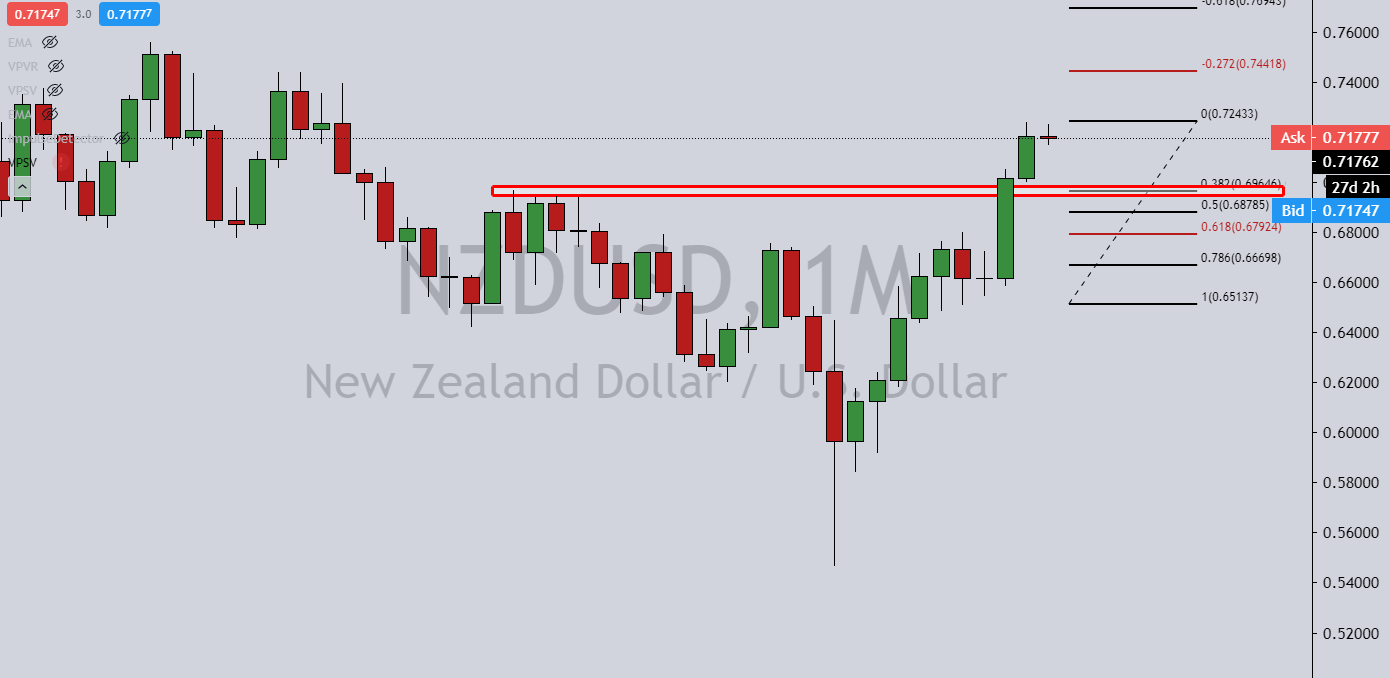
The extended run of the bullish trend could be due to a correction to the 38.2% Fibonacci level and is worth keeping on the watch list.
Weekly chart
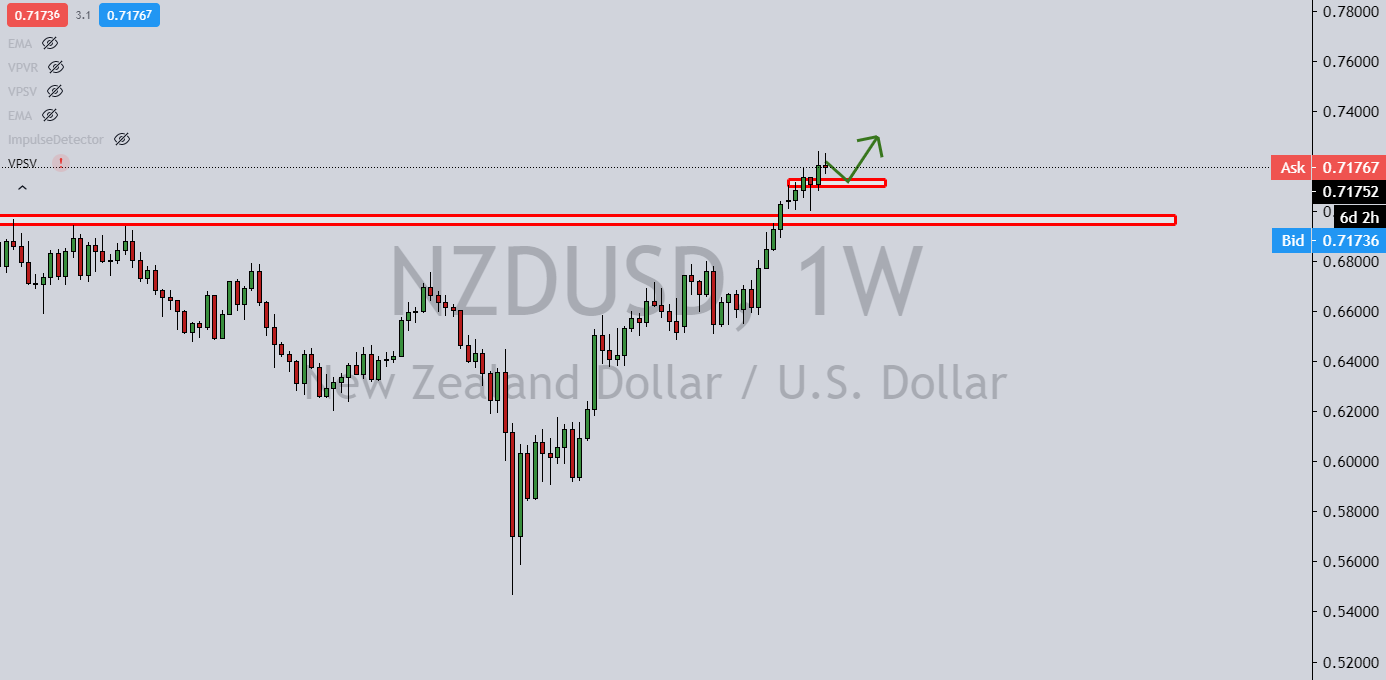
However, the weekly chart shows a strong level of support.
Daily chart
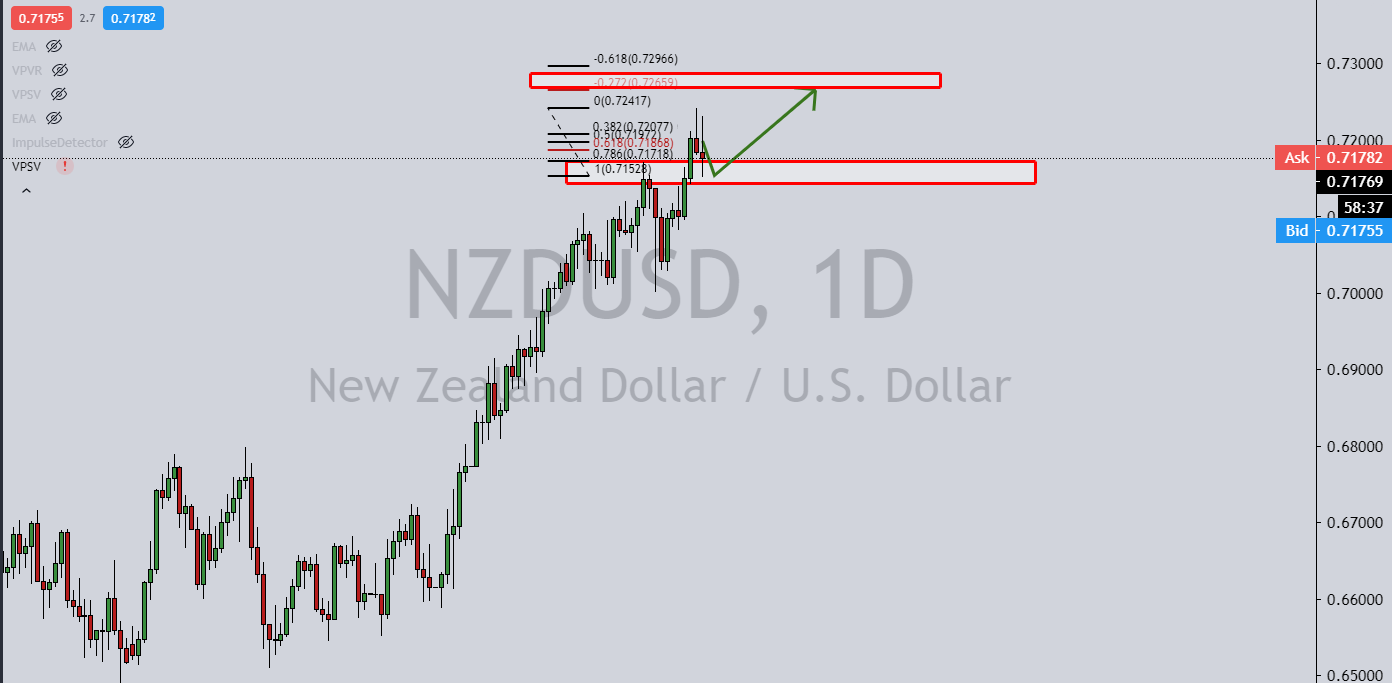
Similarly, if the support holds, then the extended W-formation could prove to show strong support at the prior resistance looking left and be the catalyst for the next upside extension.
