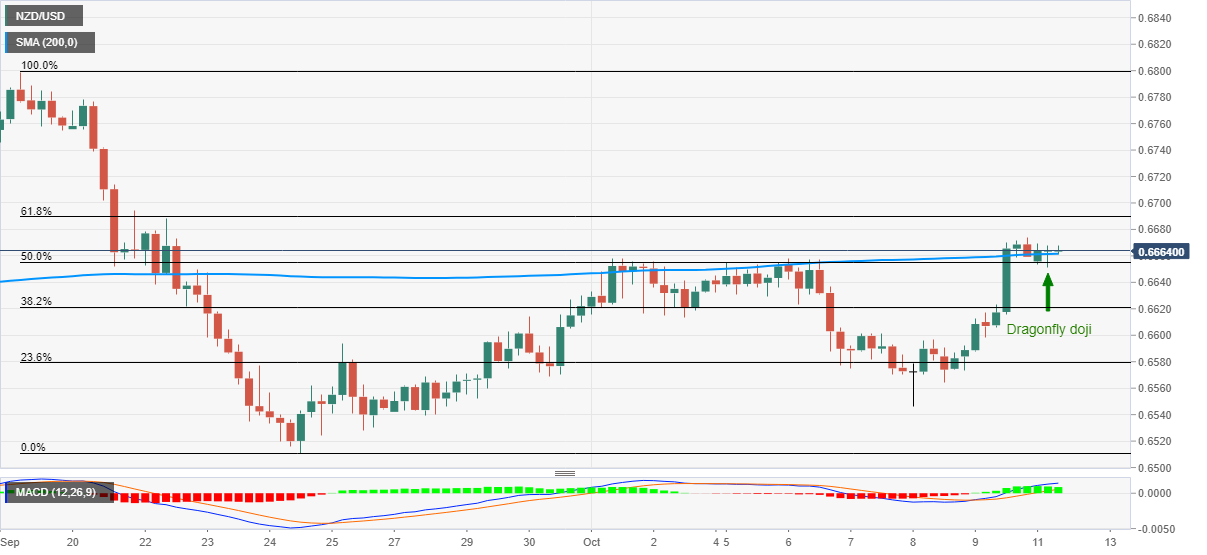
- NZD/USD probes intraday high while aiming to refresh three-week top flashed on Friday.
- A bullish candlestick formation joins upbeat MACD histogram to favor buyers targeting 61.8% Fibonacci retracement.
- Sellers will wait for a clear downside below 50% Fibonacci retracement.
NZD/USD prints mild gains while picking up the bids near 0.6665, up 0.06% intraday, ahead of Monday’s European session. Even so, the kiwi pair stays below Friday’s top, also the highest since September 22.
The quote flashes a bullish candlestick formation, namely the Dragonfly Doji, on the four-hour chart amid price-positive MACD signals. Additionally, the pair also trades above 50% Fibonacci retracement of the late-September downside and 200-bar SMA, which in turn favors NZD/USD buyers.
As a result, the 61.8% Fibonacci retracement level of 0.6690 gains the short-term traders’ attention if they manage to cross 0.6674 immediate upside hurdle.
During further advances of NZD/USD, beyond 0.6690, the 0.6700 round-figures and 0.6760 may entertain the optimists ahead of diverting them to September month’s peak surrounding the 0.6800 mark.
On the contrary, the 0.6660/55 area including 200-bar SMA and 50% Fibonacci retracement level can restrict the pair’s immediate downside.
In a case where the NZD/USD sellers dominate past-0.6655, the 0.6600 threshold will be on their radar.
NZD/USD four-hour chart
Trend: Further upside expected
