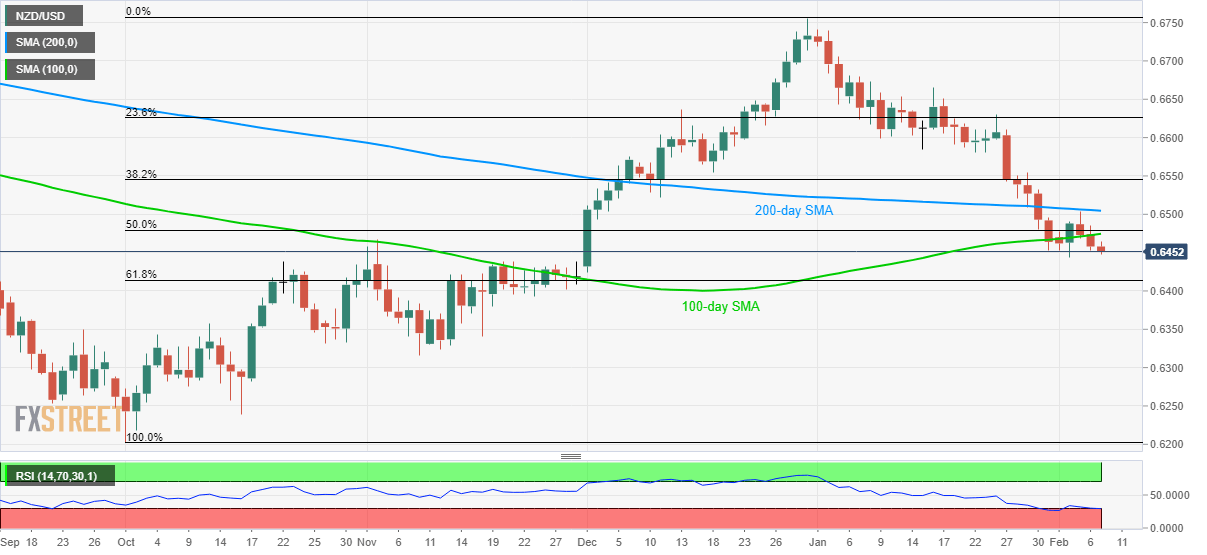
- NZD/USD trades near the weekly low despite the recovery in early signals of New Zealand inflation.
- 200-day SMA limits near-term upside, November month low can please sellers below the break of the key Fibonacci.
NZD/USD remains on the back foot around 0.6450 during early Friday. The pair recently ignored better than the previous 1.8% RBNZ inflation expectations to 1.93% while nearing the weekly low.
Read: RBNZ Survey: New Zealand inflation expectations rise, Kiwi keeps losses
During the quote’s further declines, 61.8% Fibonacci retracement of October-December 2019 upside, at 0.6414, will be the key to watch.
Should prices remain weak below 0.6414, which is less likely considering the oversold RSI, November 2019 bottom surrounding 0.6315 will return to the charts.
Alternatively, 100-day SMA and 50% Fibonacci retracement level limits the pair’s immediate upside near 0.6475/80 whereas 200-day SMA around 0.6505 can question the buyers next.
NZD/USD daily chart
Trend: Bearish

