- NZD/USD drops after facing rejection above the 200-hour SMA.
- The daily chart shows 50-day SMA is a crucial support.
NZD/USD now trades near 0.7206, representing a 0.18% drop on the day, having failed to establish a secure foothold above the 200-hour Simple Moving Average (SMA) of 0.7219 several times early Friday. The average also proved a tough nut to crack on Thursday.
The repeated rejection above the widely-followed technical hurdle may invite selling pressure, yielding a re-test of the 50-day SMA at 0.7171.
A closer look at the daily chart reveals the 50-day SMA has offered support multiple times since Jan. 28 and is the level to defend for the bulls. A daily close below that would confirm a bearish reversal on the daily chart.
A close above the Feb. 16 high of 0.7268 is needed to put the bulls into the driver’s seat.
Hourly and daily charts
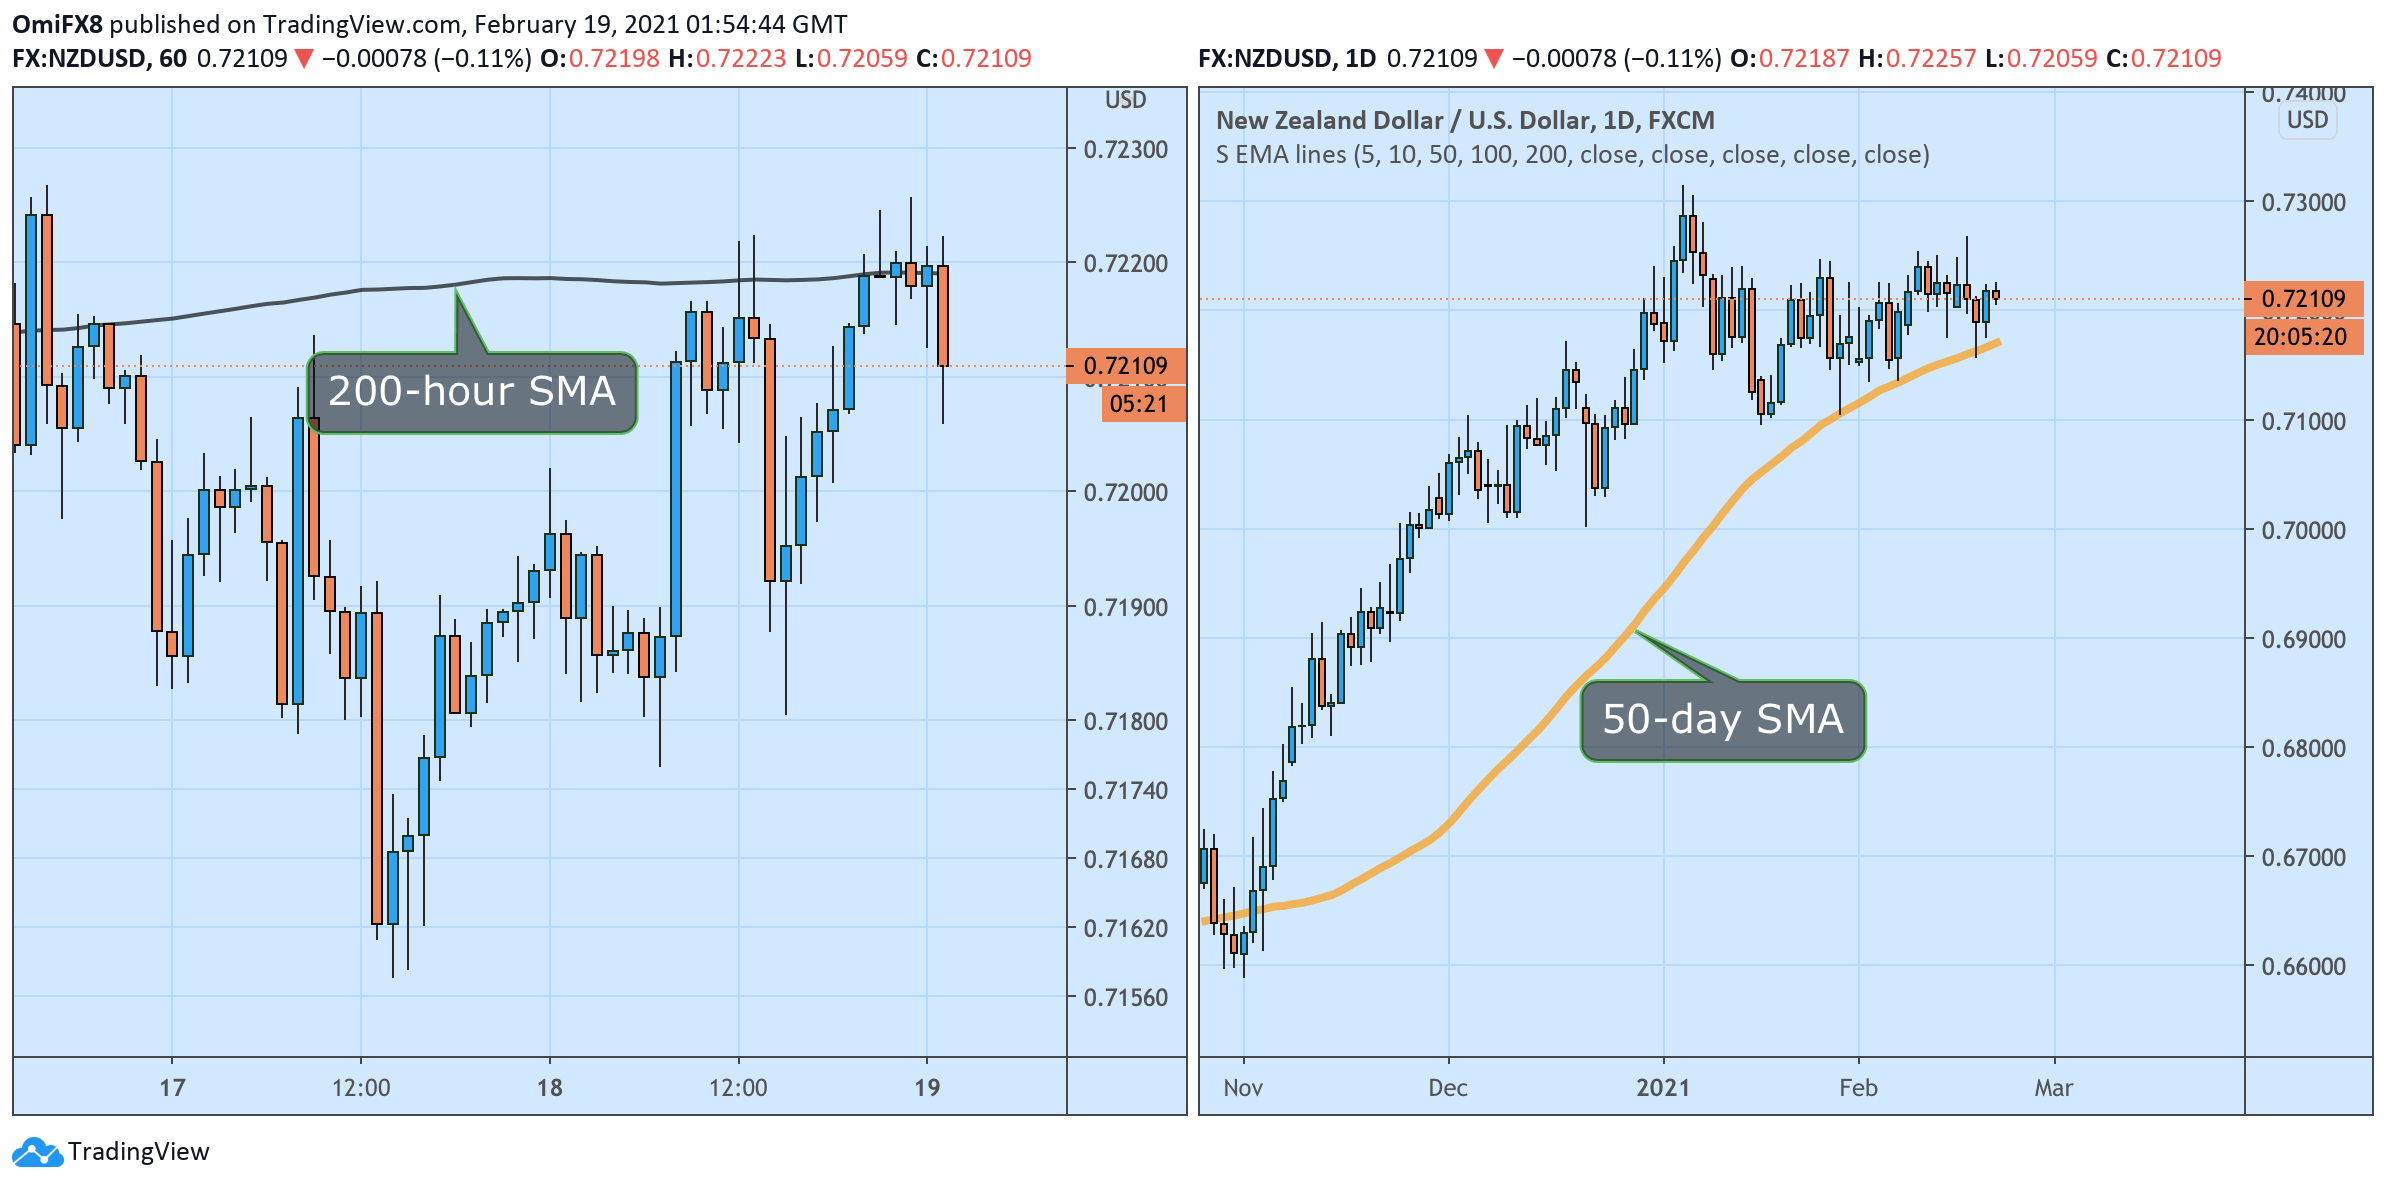
Trend: Bearish below 50-day SMA
Technical levels
