- NZD/USD extends Thursday’s losses, hits a four-week low.
- Breakdown of key support and bearish RSI favor deeper losses.
NZD/USD slipped to 0.7155 a few minutes before press time, the lowest since Feb. 5.
The pair closed below the 50-day Simple Moving Average (SMA) on Thursday, validating the bearish lower high of 0.7307 created on March 2.
The violation of the 50-day SMA in itself is bearish, as the technical line acted as strong support multiple times since Jan. 28.
That, alongside a bearish or below-50 reading on the 14-day Relative Strength Index, suggests scope for deeper losses.
Support is seen at 0.7096 (Jan. 18 low) followed by 0.7047 (100-day SMA). Meanwhile, resistance is located at 0.7210 (50-day SMA) and 0.7307 (March 2 high).
Daily chart
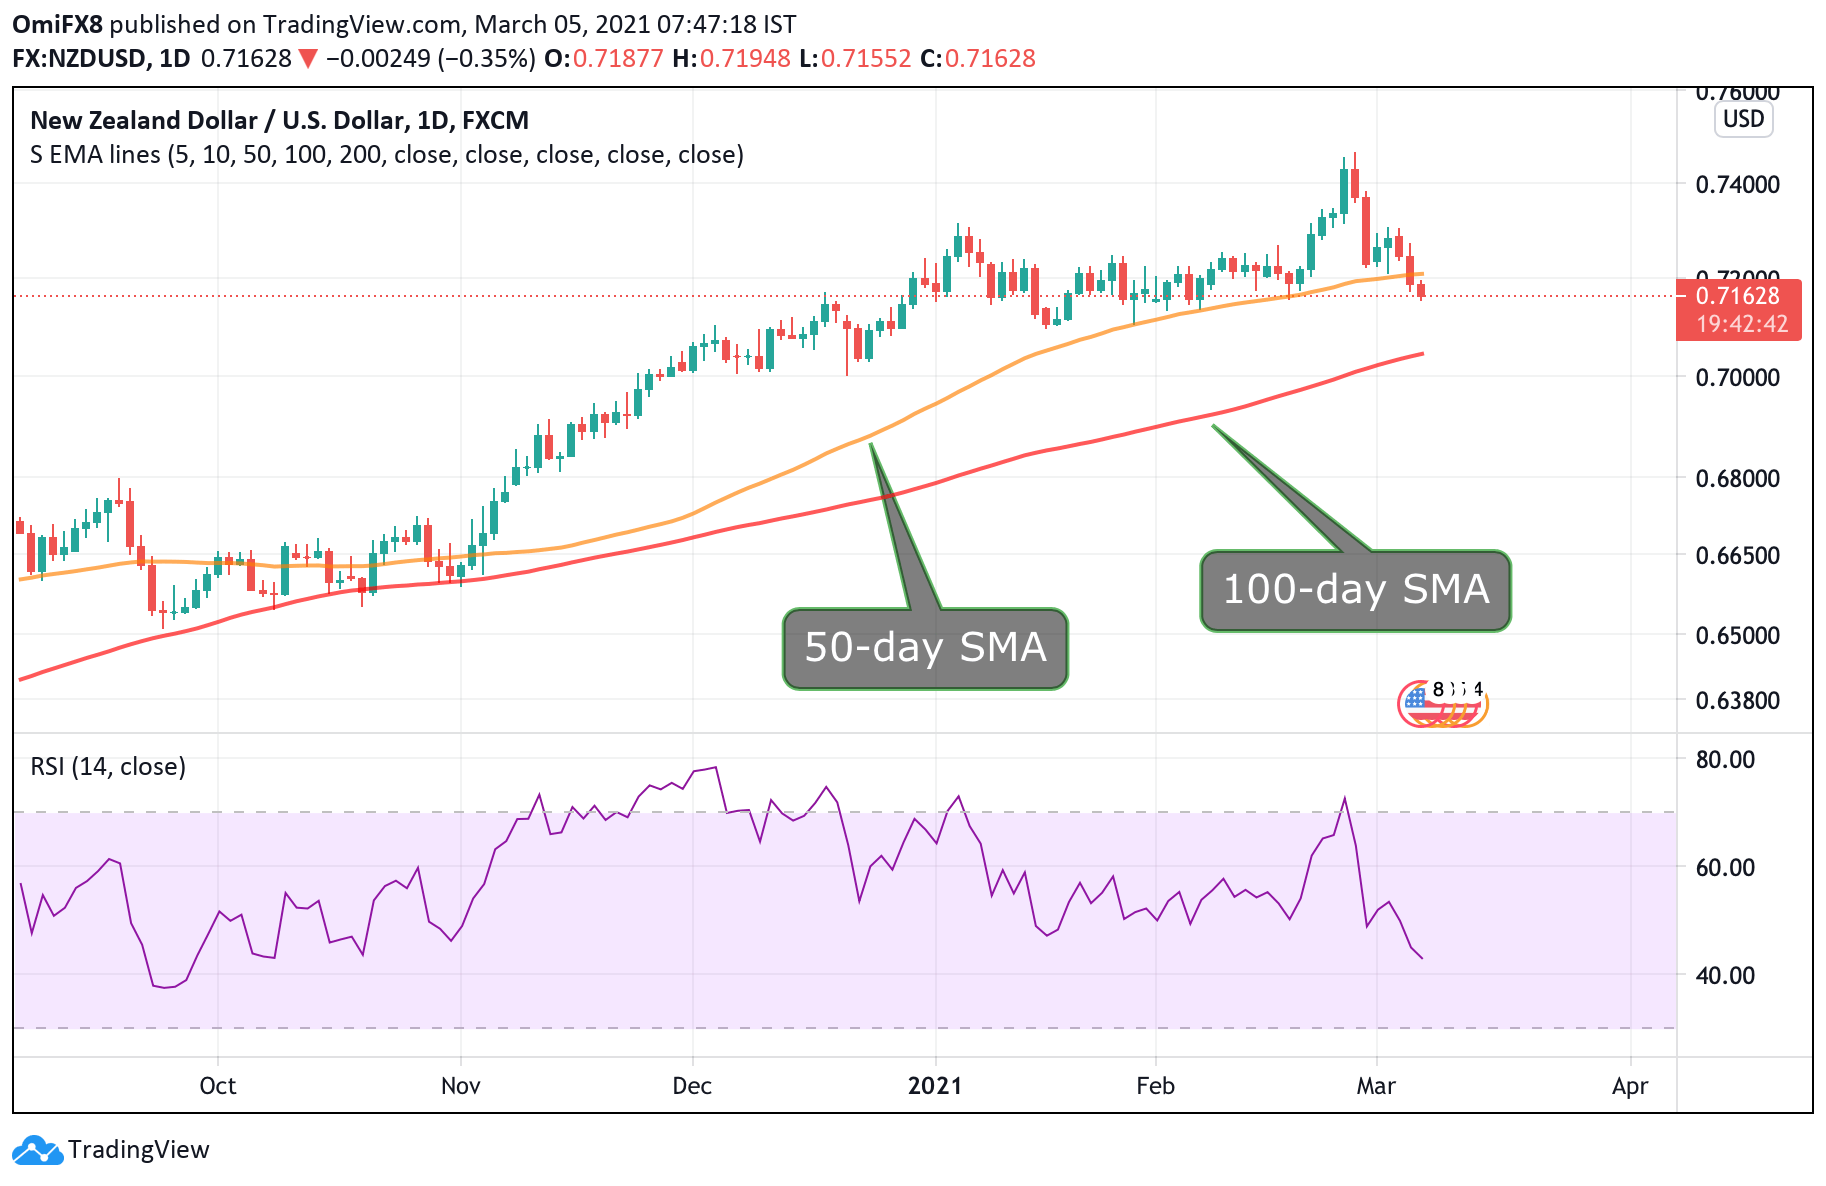
Trend: Bearish
Technical levels
