- NZD/USD hits the highest level since December 2018.
- The daily chart RSI signals overbought conditions, but price chart shows no signs of bull fatigue.
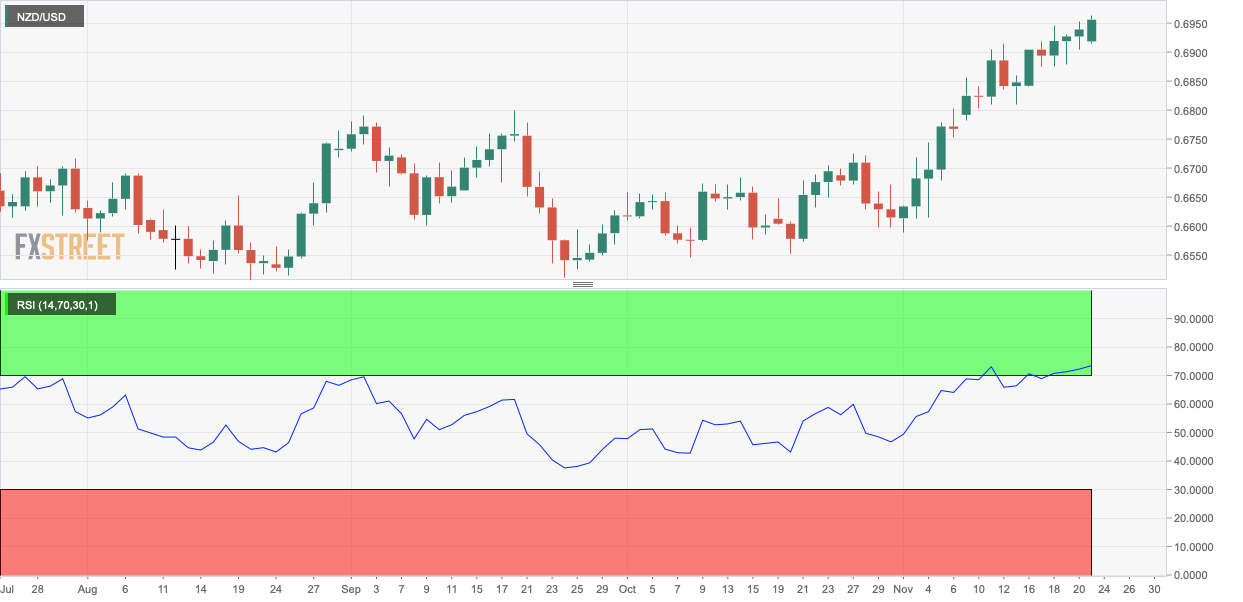
The NZD/USD pair continues to rally, defying the bull fatigue signaled by an overbought or above-70 reading on the 14-day Relative Strength Index (RSI).
The pair clocked a high of 0.6963 a few minutes before press time. That level was last seen in December 2018.
An overbought reading on the RSI indicates the rally is overstretched and due for a minor pullback or consolidation and does not imply bearish reversal. Besides, the indicator needs validation in the form of uptrend exhaustion patterns on the price chart, which, so far, have remained elusive.
As such, the path of least resistance is to the higher side, more so, as the 14-month RSI has crossed into bullish territory above 50. Significant resistance is seen at 0.7176 (200-month Simple Moving Average). Meanwhile, support is located at 0.6789 (Sept. 2 low).
Daily chart
Trend: Bullish
Technical levels
