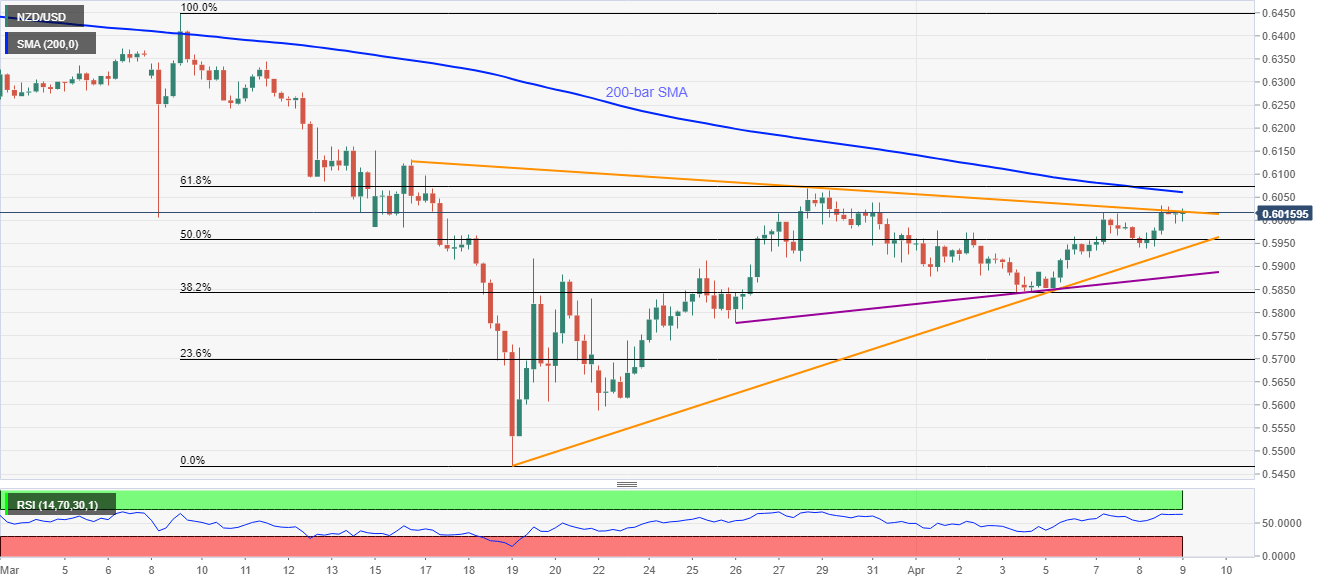
- NZD/USD struggles to extend the three-day winning streak.
- 200-bar SMA, 61.8% Fibonacci retracement add to the upside barriers.
- Ascending trend line from late-March limit near-term declines.
Having surged for three consecutive days, NZD/USD seesaws around short-term resistance line while trading near 0.6010 amid the early Thursday. Also favoring the odds of a pullback is the RSI condition that’s adjacent to the overbought area.
Hence, the kiwi pair is expected to take a U-turn towards 50% Fibonacci retracement of early-March fall, near 0.5995.
Though, the pair’s declines below the key Fibonacci might find it hard to sustain considering the presence of two ascending trend lines from March 19 and March 26, respectively around 0.5940 and 0.5880.
Meanwhile, 200-bar SMA and 61.8% of Fibonacci retracement, near 0.6060 and 0.6075 in that order, could keep the buyers in check.
If at all NZD/USD prices manage to cross 0.6075, 0.6130 and 0.6160 will be on the bulls’ radars.
NZD/USD four-hour chart
Trend: Pullback expected

