- NZD/USD bounces off intraday low of 0.6394 to stay above short-term key support.
- Oversold RSI, ascending support line and trend reversal suggesting candlestick formation signal the pair’s recovery.
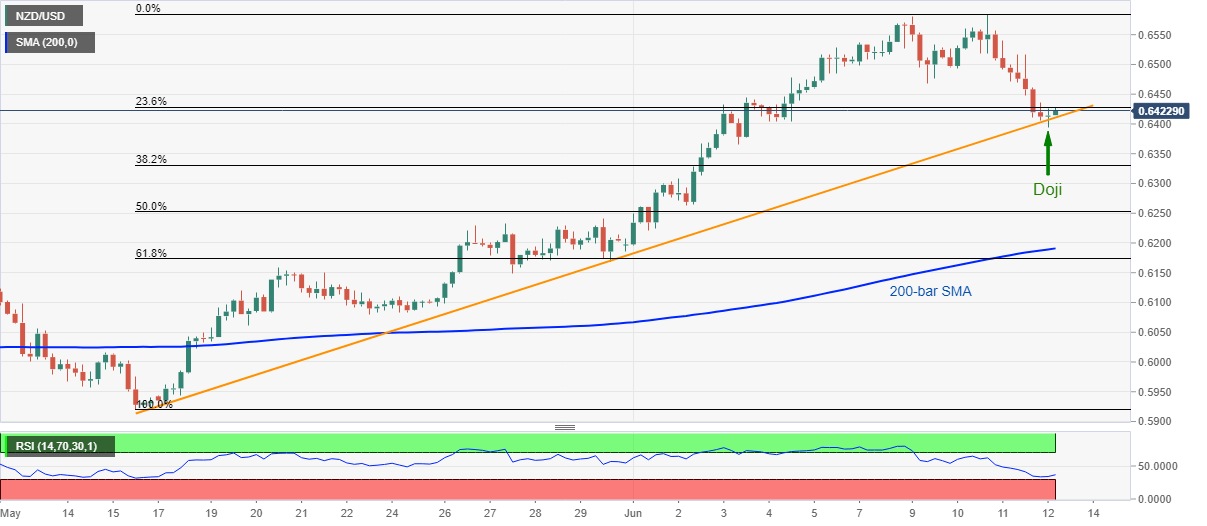
- Late-May tops, 200-bar SMA and 61.8% Fibonacci retracement could lure the bears below trend line support.
NZD/USD recovers from one-week low to 0.6420, still down 0.13% on a day, during the pre-European session on Friday. In doing so, the kiwi pair takes a U-turn from an ascending trend line from March 15 amid oversold RSI conditions.
Other than the said trend line support and RSI, a Doji candlestick on the four-hour chart also increases the odds for the pair’s further recovery.
As a result, Tuesday’s low of 0.6469 could serve as an immediate upside barrier ahead of the monthly top, also the highest since late-January, near 0.6585. During the quote’s additional rise past-0.6585, the mid-January top close to 0.6665/70 might appear on the bulls’ radars.
On the contrary, fresh intraday low under could negate the bullish view and can further weaken the pair to 0.6360.
Further, the sellers’ dominance below 0.636 might not hesitate to aim for the late-May highs near 0.6230/35 whereas 200-bar SMA and 61.8% Fibonacci retracement of May-June upside, respectively around 0.6190 and 0.6175, can please the bears.
NZD/USD four-hour chart
Trend: Pullback expected
