- NZD/USD extends the previous day’s losses, though immediate triangle tames the bears.
- 200-HMA, 61.8% Fibonacci retracement add to the supports.
- Bulls need validation from June month’s top to attack late-January top.
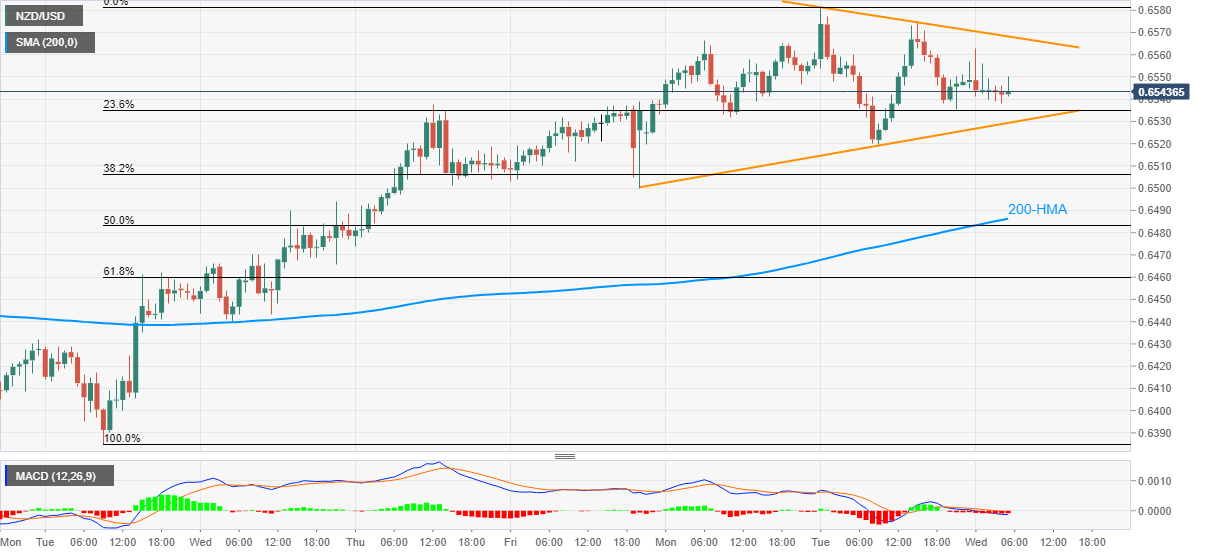
NZD/USD eases to 0.6543, down 0.05% on a day, during the pre-European session on Wednesday. The kiwi pair prints a two-day-old symmetrical triangle pattern on the hourly chart while stretching Tuesday’s U-turn from the monthly top.
The quote currently drops towards the formation support of 0.6530 with the bearish MACD and repeated failures to cross 0.6580/85 favoring the sellers.
During the pair’s downside break of the triangle, 0.6500 and 200-HMA level of 0.6485 might offer intermediate halts before diverting the bears to 61.8% Fibonacci retracement of June 30 to July 07 upside, at 0.6460 now.
Alternatively, the buyer’s ability to cross the triangle’s resistance, currently around 0.6570 will again push them to challenge the key 0.6580/85 resistance area including June month’s peak.
In a case where the bulls manage to conquer 0.6585 on a daily basis, January 24 high surrounding 0.6630 will flash on their radars.
NZD/USD hourly chart
Trend: Sideways
