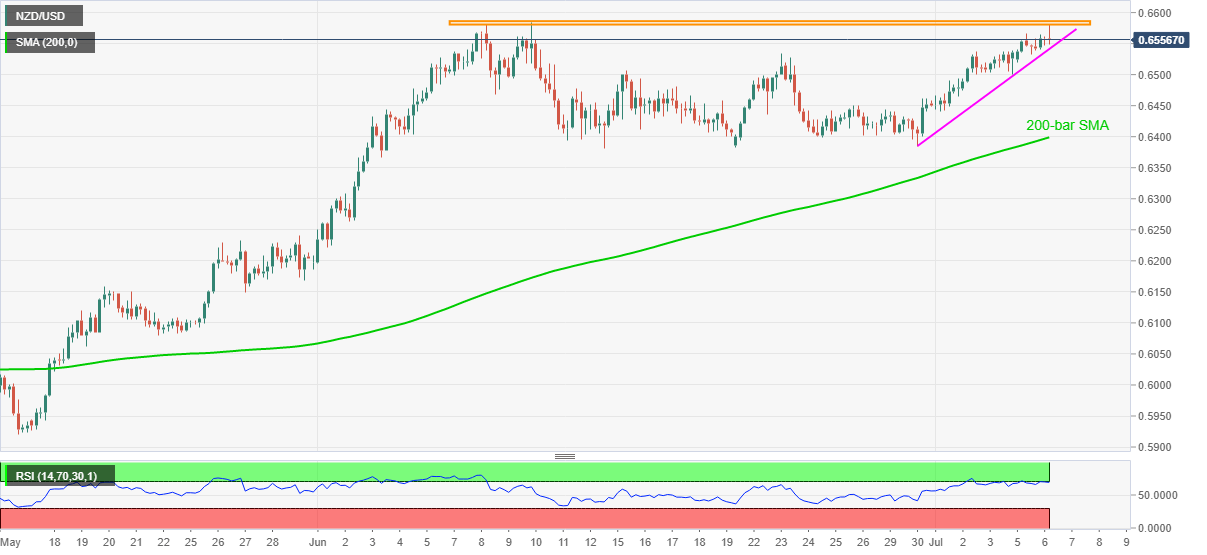
- NZD/USD again recedes from 0.6580/85 resistance area.
- Overbought RSI conditions favor further weakness but short-term ascending trend line probes the bears.
- 200-bar SMA offers strong support, bulls may aim for the mid-January tops during the further upside.
NZD/USD eases from 0.6581 to 0.6565 during the early Tuesday’s trading. In doing so, the kiwi pair repeats its inability to cross the 0.6580/85 resistance area, established since early June, backed by overbought RSI conditions.
However, an upward sloping trend line from June 30, at 0.6540 now, could question the pair’s further weakness, if not then 0.6500 and June 26 top close to 0.6450 might lure the bears.
During the quote’s additional weakness past-0.6450, 200-bar SMA around 0.6400, followed by the mid-June bottom surrounding 0.6380, will be the key to watch.
Alternatively, the pair’s clear rise past-0.6585 enables the bulls to quickly cross 0.6600 round-figures and aim for the mid-January tops near 0.6665.
If at all the bulls remain dominant past-0.6665, 0.6700 and December 2019 peak close to 0.6755/60 will return to the charts.
NZD/USD four-hour chart
Trend: Pullback expected
