- NZD/USD confirms a symmetrical triangle breakout on the 1D chart.
- RBNZ points to a September 2022 rate hike, Kiwi takes a flight.
- Further upside likely in place, as RSI holds firmer above 50.00.
NZD/USD is extending its rally above 0.7300 after the Reserve Bank of New Zealand (RBNZ) pointed to a potential rate hike in September 2022 amid notable improvement in the economic situation.
The RBNZ’s hawkish surprise offered the much-needed boost to the kiwi bulls, as the price witnessed a big technical breakout on the daily sticks.
The kiwi confirmed a symmetrical triangle breakout on the said time frame after it raced past the falling trendline resistance at 0.7238 on a sustained basis.
At the press time, the spot is up 1.05% on the day, trading at the highest levels in three-month near 0.7310.
With the Relative Strength Index (RSI) holding firmly above the midline while eyeing the overbought territory, a test of the 0.7350 psychological levels remains on the cards.
NZD/USD daily chart
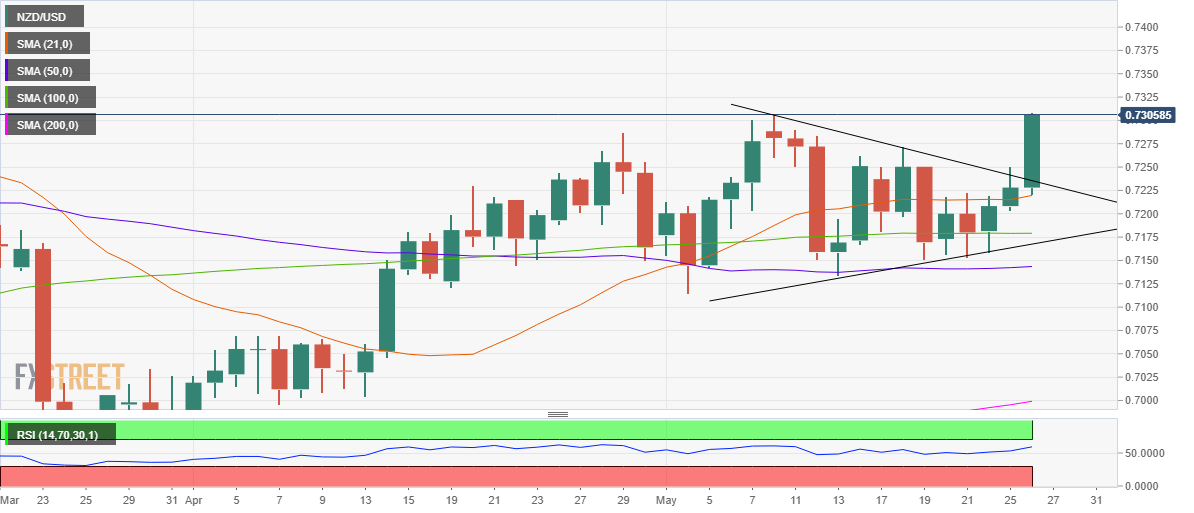
However, any pullback moves would see a test of the triangle resistance now support, below which the 21-daily moving average (DMA) at 0.7219 could emerge as a strong cap.
All in all, the path of least resistance appears to the upside.
NZD/USD additional levels to watch
