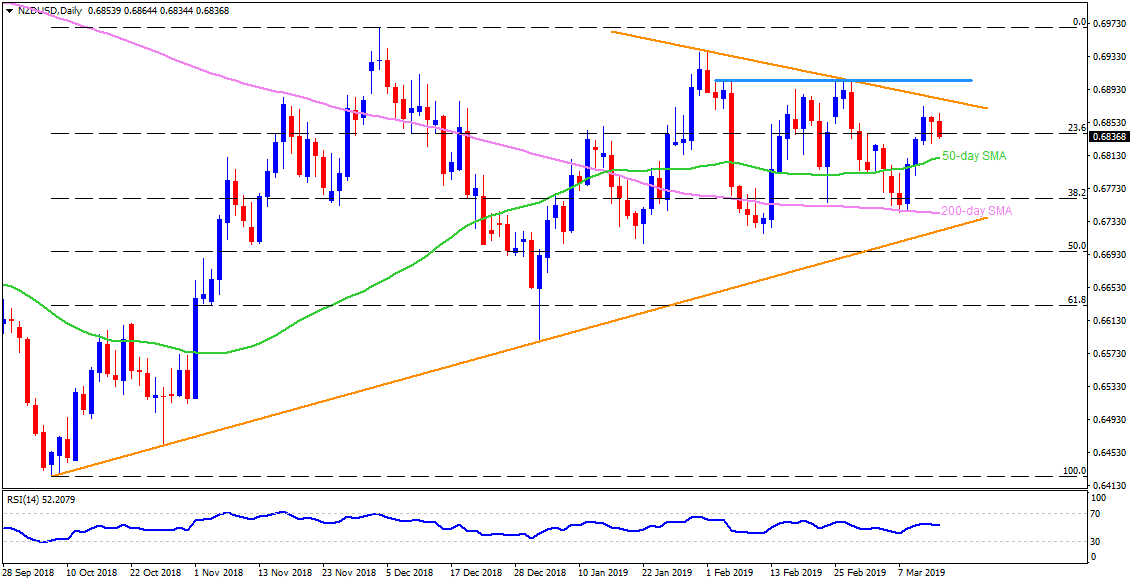
NZD/USD daily chart
- NZD/USD bears the burden of sluggish China data as it prints fresh intra-day low around 0.6835 on early Thursday.
- The daily chart shows the 50-day simple moving average (SMA) figure of 0.6810 as nearby support prior to highlighting 0.6790 and 200-day SMA level of 0.6740.
- However, an upward sloping trend-line ranging from October 2018, at 0.6720, could confine the quote’s additional declines past-0.6740.
- Should the pair fail to respect 0.6740 then 50% Fibonacci retracement level of October – December 2018 moves, near 0.6790, can become bears’ favorite.
- Alternatively, an upside clearance of 0.6870 may escalate the recovery toward six-week-old descending trend-line, at 0.6885.
- Pair’s break of 0.6885 could avail 0.6905-10 as an intermediate halt before challenging 0.6940 and 0.6970 numbers to the north.
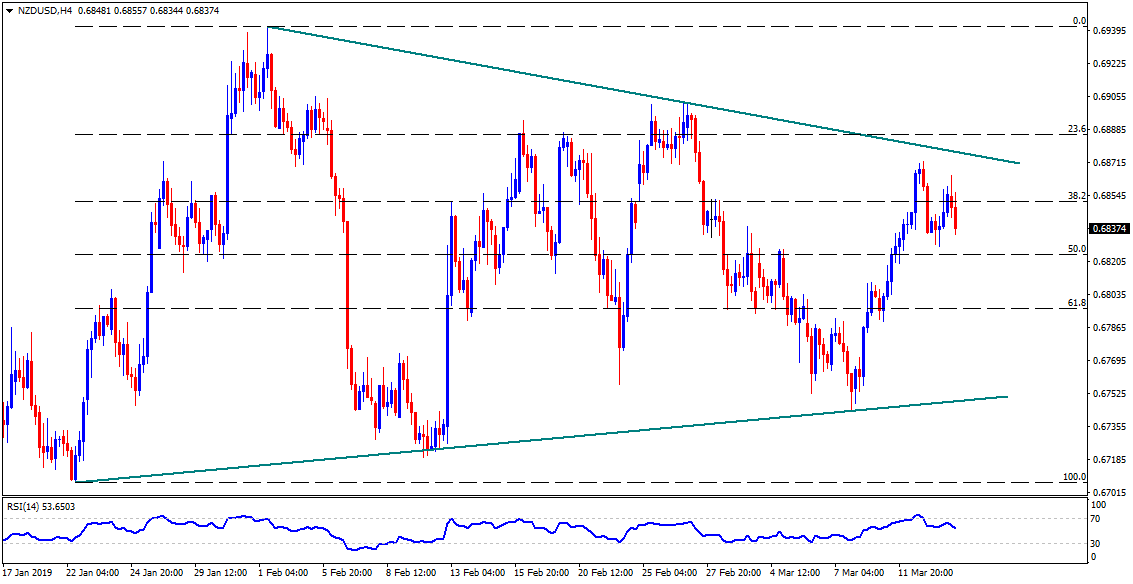
NZD/USD 4-Hour chart
- January 22 low around 0.6710, followed by 0.6700 round-figure might entertain sellers’ past-0.6720.
- Meanwhile, 0.6860 could limit the pair’s immediate increase.
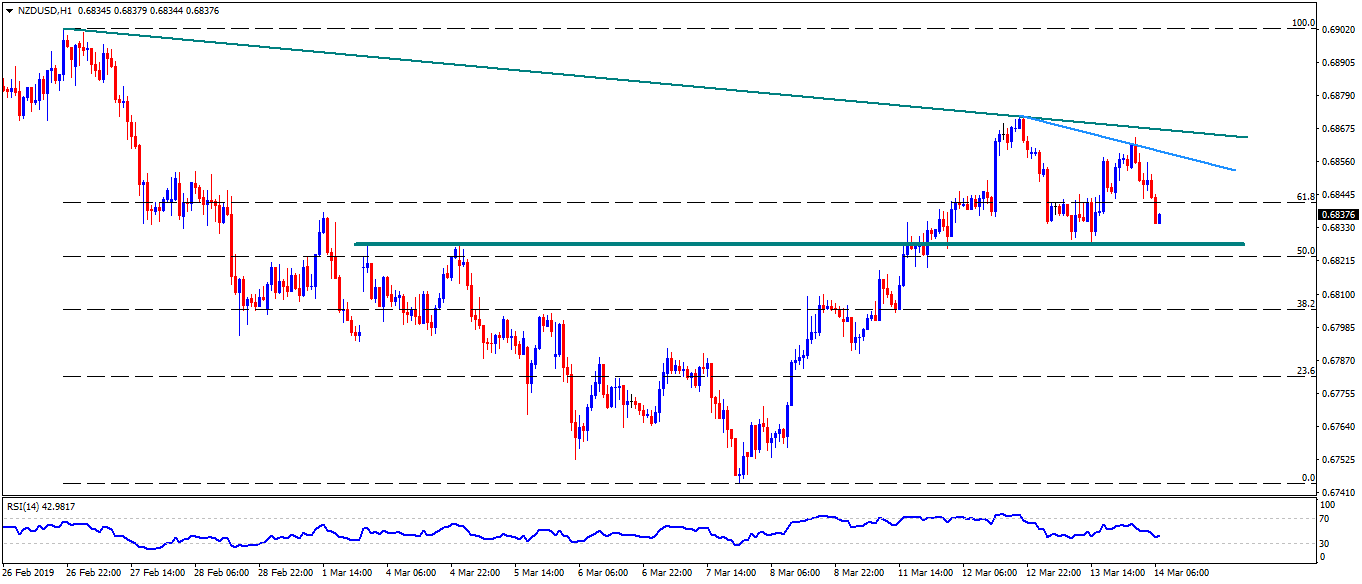
NZD/USD hourly chart
- A horizontal-area joining highs of March 04 to the lows of March 13 may question sellers ahead of diverting them to 50-day SMA level of 0.6810.