- 100-hour SMA and overbought RSI question pair’s recovery from 0.6540.
- 0.6515 and 0.6480 seem strong downside supports.
Despite bouncing off 0.6540, the NZD/USD pair is still under 100-hour simple moving average (HMA) near 0.6550 while heading into the Europe open Tuesday.
In addition to the quote’s failure to cross 100-HMA, overbought conditions of 14-bar relative strength index (RSI) also favors sellers targeting 0.6540 revisits.
Should prices slip beneath 0.6540, 0.6515 and current month low around 0.6480 could become bears’ favorites.
In a case where prices continue trading south after 0.6480, October 2018 low near 0.6460 and the year 2018 bottom around 0.6425 may grab market attention.
Alternatively, a sustained break of 0.6555 comprising 100-HMA can trigger the pair’s recovery towards 0.6585 and then to 50% Fibonacci retracement of mid-April to May downpour, at 0.6635.
During successful trading above 0.6635, 0.6685/90 and 0.6730 could lure buyers.
NZD/USD 4-Hour chart
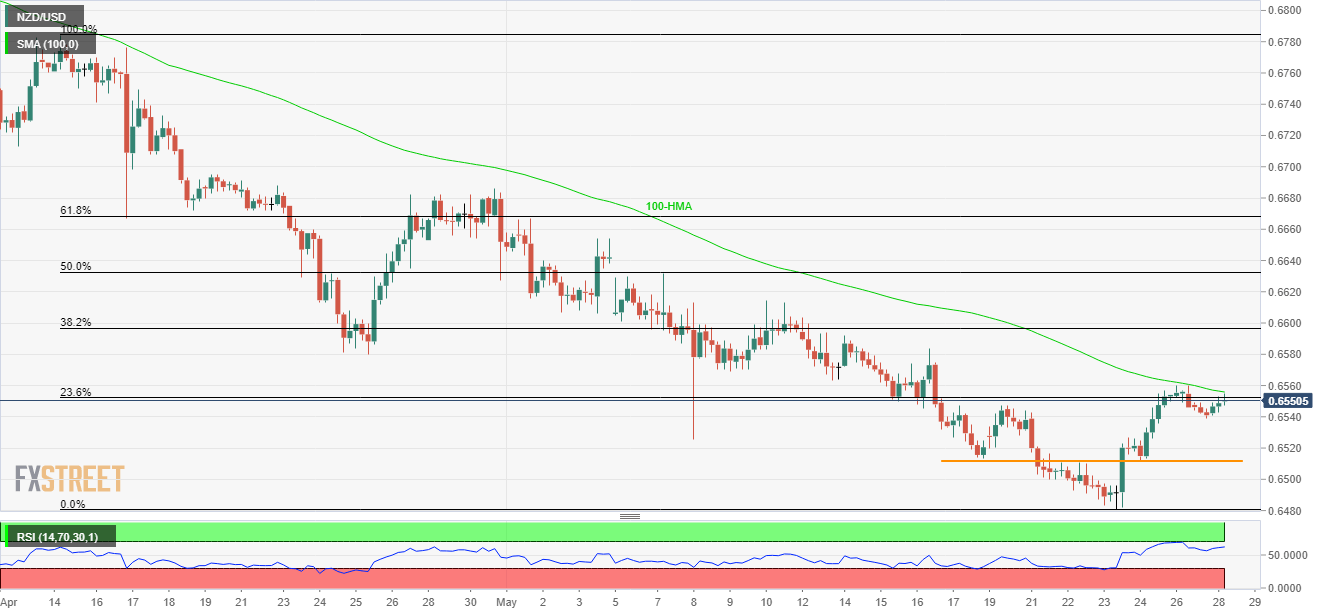
Trend: Pullback expected
