- One-week-old descending trend-channel, 100-HMA limit immediate upside despite bullish MACD.
- 0.6405 offers near-term strong support ahead of current month low.
Despite a bullish signal by the key technical indicator, the NZD/USD pair remains below adjacent resistances while it trades near 0.6440 during early Thursday.
The 0.6457/60 becomes the key resistance-confluence, including 100-hour moving average (HMA) and one-week-old falling channel, for buyers to watch if they prefer bullish signal by the 12-bar moving average convergence and divergence (MACD) indicator.
It should, however, be noted that pair’s rally past-0.6460 can trigger fresh rise targeting 61.8% Fibonacci retracement level of 0.6510 whereas August 07 high near 0.6560 can please buyers afterward.
Alternatively, 23.6% Fibonacci retracement level of 0.6428 and channel support figure of 0.6405 could keep sellers at bay.
In a case where prices slip under 0.6405, month’s low near 0.6378 gain market attention.
NZD/USD hourly chart
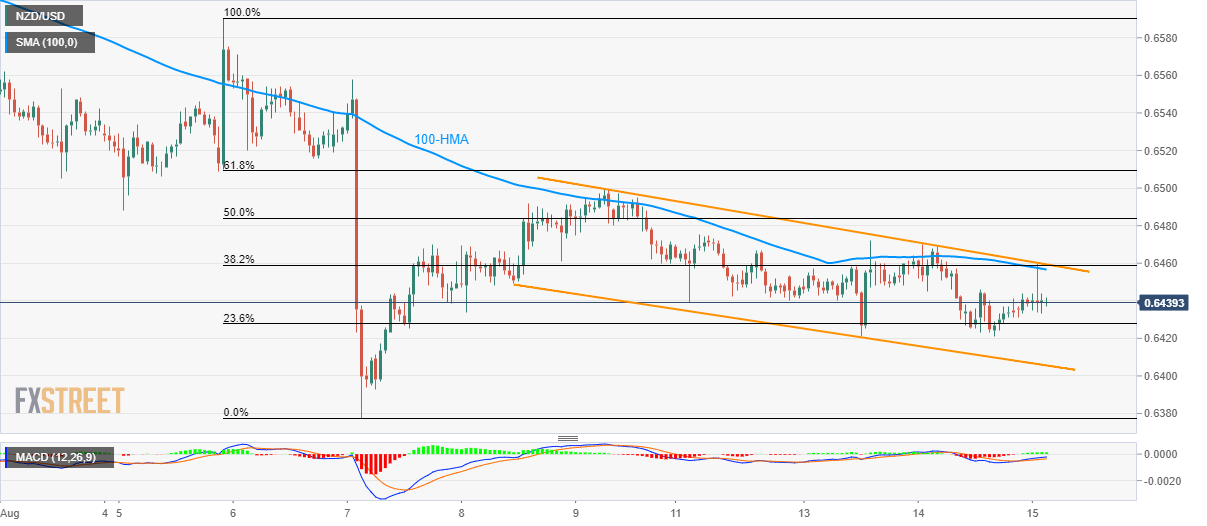
Trend: Bearish
