- Successful trading beyond 100-day EMA, rising RSI, favors the NZD/USD pair’s an upside.
- Buyers targeting March lows, mid-April highs await the break of near-term key resistances.
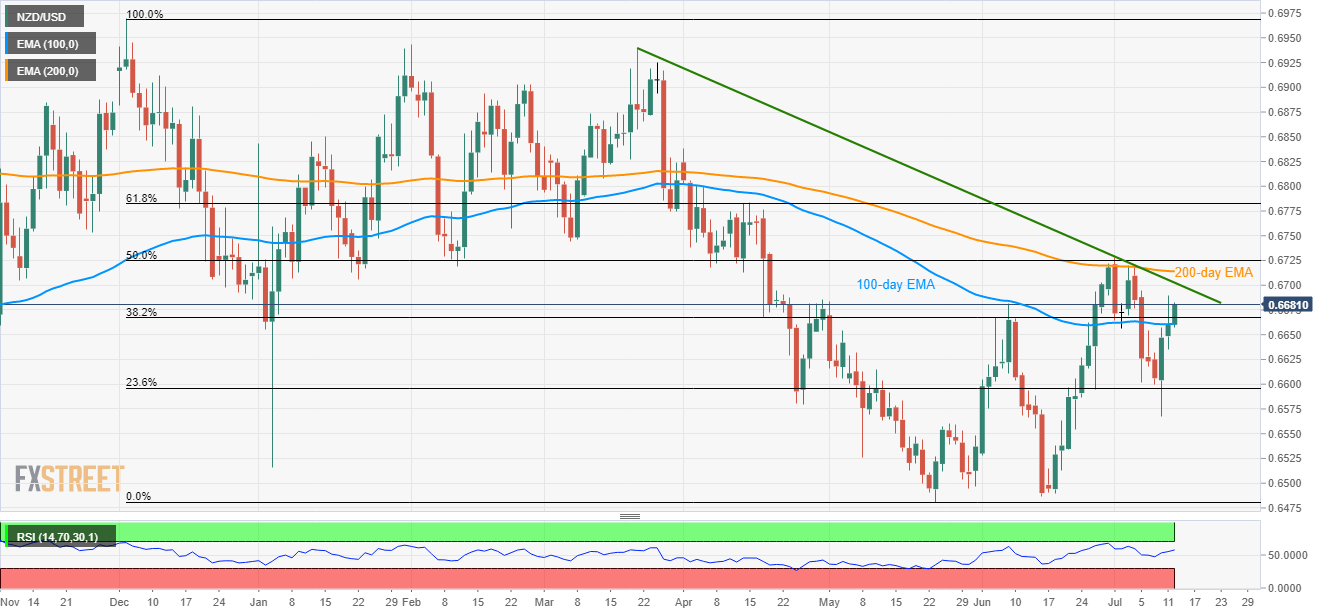
With the sustained break of a 100-day exponential moving average (EMA), the NZD/USD pair seems all set to question near-term key resistances as it takes the rounds to 0.6680 during early Friday.
Among the crucial upside barriers, a downward sloping trend-line stretched since late-March around 0.6702 will be the first to challenge buyers whereas 200-day EMA level of 0.6714 and 50% Fibonacci retracement of December 2018 to May 2019 decline, at 0.6725, can question bulls afterward.
If optimists manage to cross 0.6725, March month low near 0.6744 and the mid-April highs surrounding 0.6784 can please them.
Supporting the upside momentum is ascending but not the overbought pattern of 14-day relative strength index (RSI).
Should prices again slip beneath 100-day EMA level of 0.6660, 0.6610 can offer an intermediate halt to the pair’s slump to 23.6% Fibonacci retracement level of 0.6600.
During the pair’s extended south-run below 0.6600, late-May month high around 0.6560 should be on the bears’ list.
NZD/USD daily chart
Trend: Pullback expected
