- NZD/USD pulls back from near-term key resistance even if China flashed better than forecast CPI/PPI data.
- 0.6412/10 acts as immediate support, 38.2% Fibonacci retracement and August 09 high could please buyers during further upside.
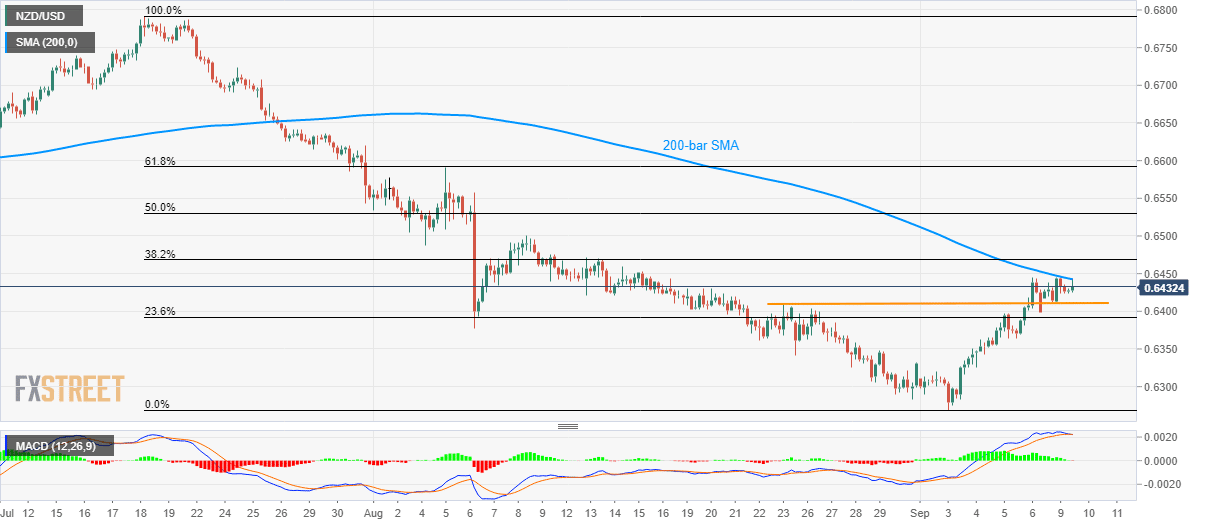
The 200-bar simple moving average (SMA) questions the NZD/USD pair’s strength as it takes the rounds to 0.6435 during Tuesday’s Asian session.
The 200-bar SMA, at 0.6445 now, successfully holds the pair captive despite China’s August month consumer price index (CPI) and producer price index (PPI) grew past forecasts of +2.6% and -0.9% (YoY) to +2.8% and -0.8% respectively. Investors might have focused more on the PPI data as it lagged behind -0.3% prior.
With the receding strength of 12-bar moving average convergence and divergence (MACD) histogram, coupled with repeated failures to cross key SMA, prices are likely to witness a pullback towards 0.6412/10 horizontal area including Monday’s low and August 23 high.
In a case where the quote slips below 0.6410, August 07 low near 0.6375 and September-start top surrounding 0.6320 could appear on sellers’ radar.
Alternatively, an upside clearance of 0.6445 SMA level could propel prices to 38.2% Fibonacci retracement of July-September declines, near 0.6470, while August 09 high of 0.6500 could please buyers then after.
It should also be noted that pair’s run-up beyond 0.6500 could as well challenge 61.8% Fibonacci retracement level of 0.6593.
NZD/USD 4-hour chart
Trend: pullback expected
