- NZD/USD trades near the highest in five months after breaking a falling trend line since late-March.
- 50% of Fibonacci retracement will act as an intermediate halt during the extended rise.
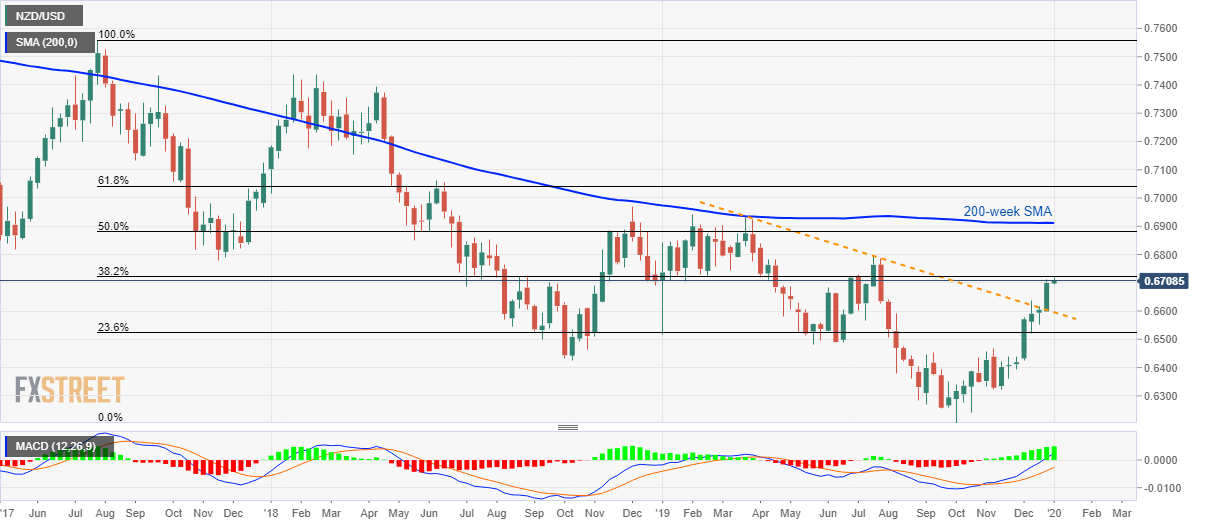
NZD/USD takes the bids to 0.6710 during the early trading session on Monday. The kiwi pair confronts 38.2% Fibonacci retracement of July 2017 top to October 2019 downpour. It should, however, be noted that the quote sustains its break of multi-month-old trend line resistance (now support).
With this, prices are likely to extend their seven-week-old upward trajectory towards the 200-week Simple Moving Average (SMA) level of 0.6912. However, July 2019 high near 0.6792 and 50% Fibonacci retracement level of 0.6880 can question buyers during the run-up.
If at all the Bulls manage to dominate beyond 0.6912, the 0.7000 psychological magnet and 61.8% Fibonacci retracement near 0.7040 could be on their watch-list.
Meanwhile, a downside break below the resistance-turned-support, at 0.6600, will fetch the quote to 23.6% Fibonacci retracement, at 0.6525.
Additionally, pair’s further weakness under 0.6525 will have its way down to September month top close to 0.6450.
NZD/USD weekly chart
Trend: Bullish
