“¢ Finally breaks down of the Asian session consolidation phase and weakness below 100-hour SMA was seen as key for bearish traders.
“¢ A follow-through selling, leading to a subsequent break below recent daily closing lows support near the 0.6865-60 region would suggest the resumption of the prior weakening trend.
“¢ Short-term technical indicators hold in negative territory and further reinforce the short-term bearish outlook, with the 0.6900 handle now acting as a key barrier on the upside.
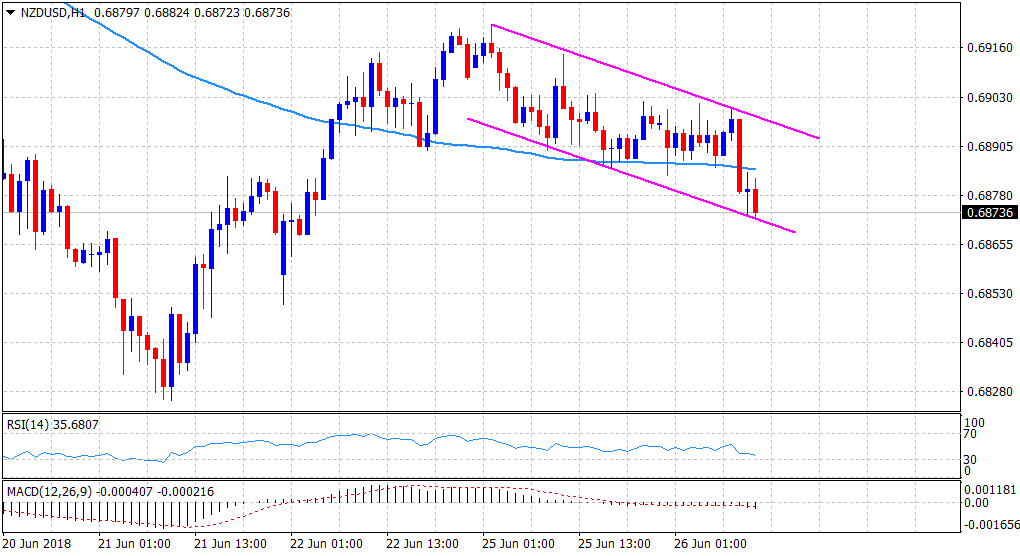
Current Price: 0.6874
Daily High: 0.6902
Trend: Bearish
Resistance
R1: 0.6902 (current day swing high)
R2: 0.6917 (200-period SMA H1)
R3: 0.6942 (R2 daily pivot-point)
Support
S1: 0.6862 (daily closing low set on May 15)
S2: 0.6846 (S3 daily pivot-point)
S3: 0.6826 (last Thursday’s swing low)
