- NZD’s recovery from post-CPI low of 0.6750 could end up creating an inverse head-and-shoulders pattern with neckline resistance of 0.6795.
- A break above the neckline would open doors to 0.6865 (target as per the measured move method).
Hourly chart
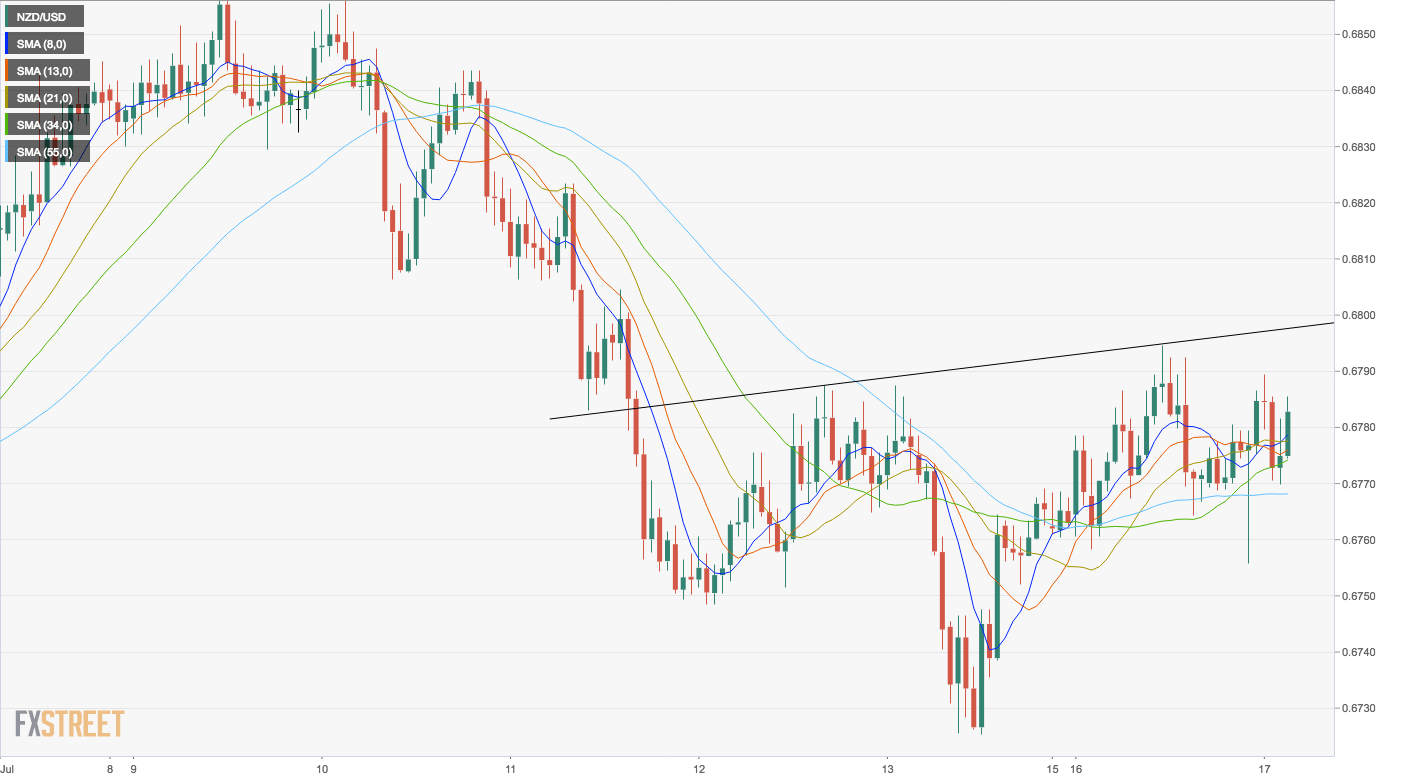
Spot Rate: 0.6775
Daily High: 0.6788
Daily Low: 0.6755
Trend: Bullish above 0.6795
R1: 0.6795 (inverse head-and-shoulders neckline)
R2: 0.6804 (20-day MA – acted as stiff hurdle on July 9,10, and 11)
R3: 0.6859 (July 9 high)
Support
S1: 0.6748 (July 12 low)
S2: 0.6725 (July 13 low)
S3: 0.6688 (July 3 low)
