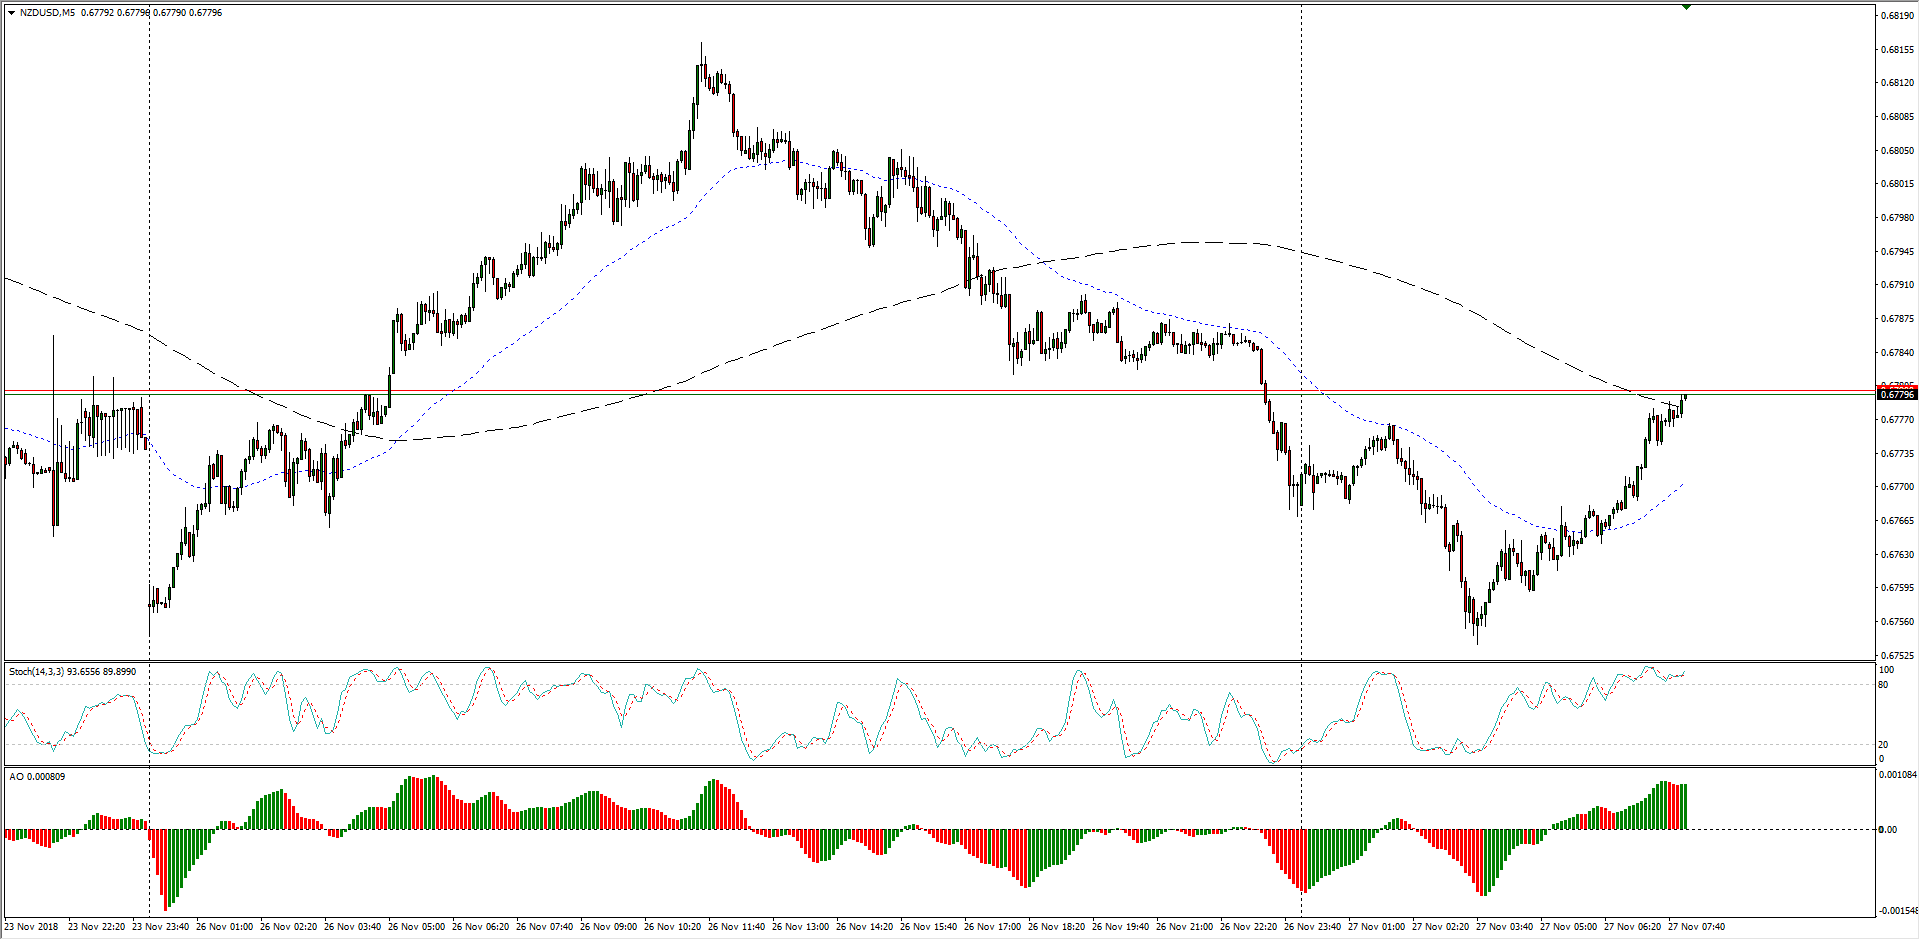
- The Kiwi is seeing another intraday cyclical rebound from lows near 0.6750 in a repeat of Monday’s market action that saw the NZD/USD lurch to 0.6815 before bedding back down as broader market action saw overall flows push out of and then back into the US Dollar.
NZD/USD Chart, 5-Minute
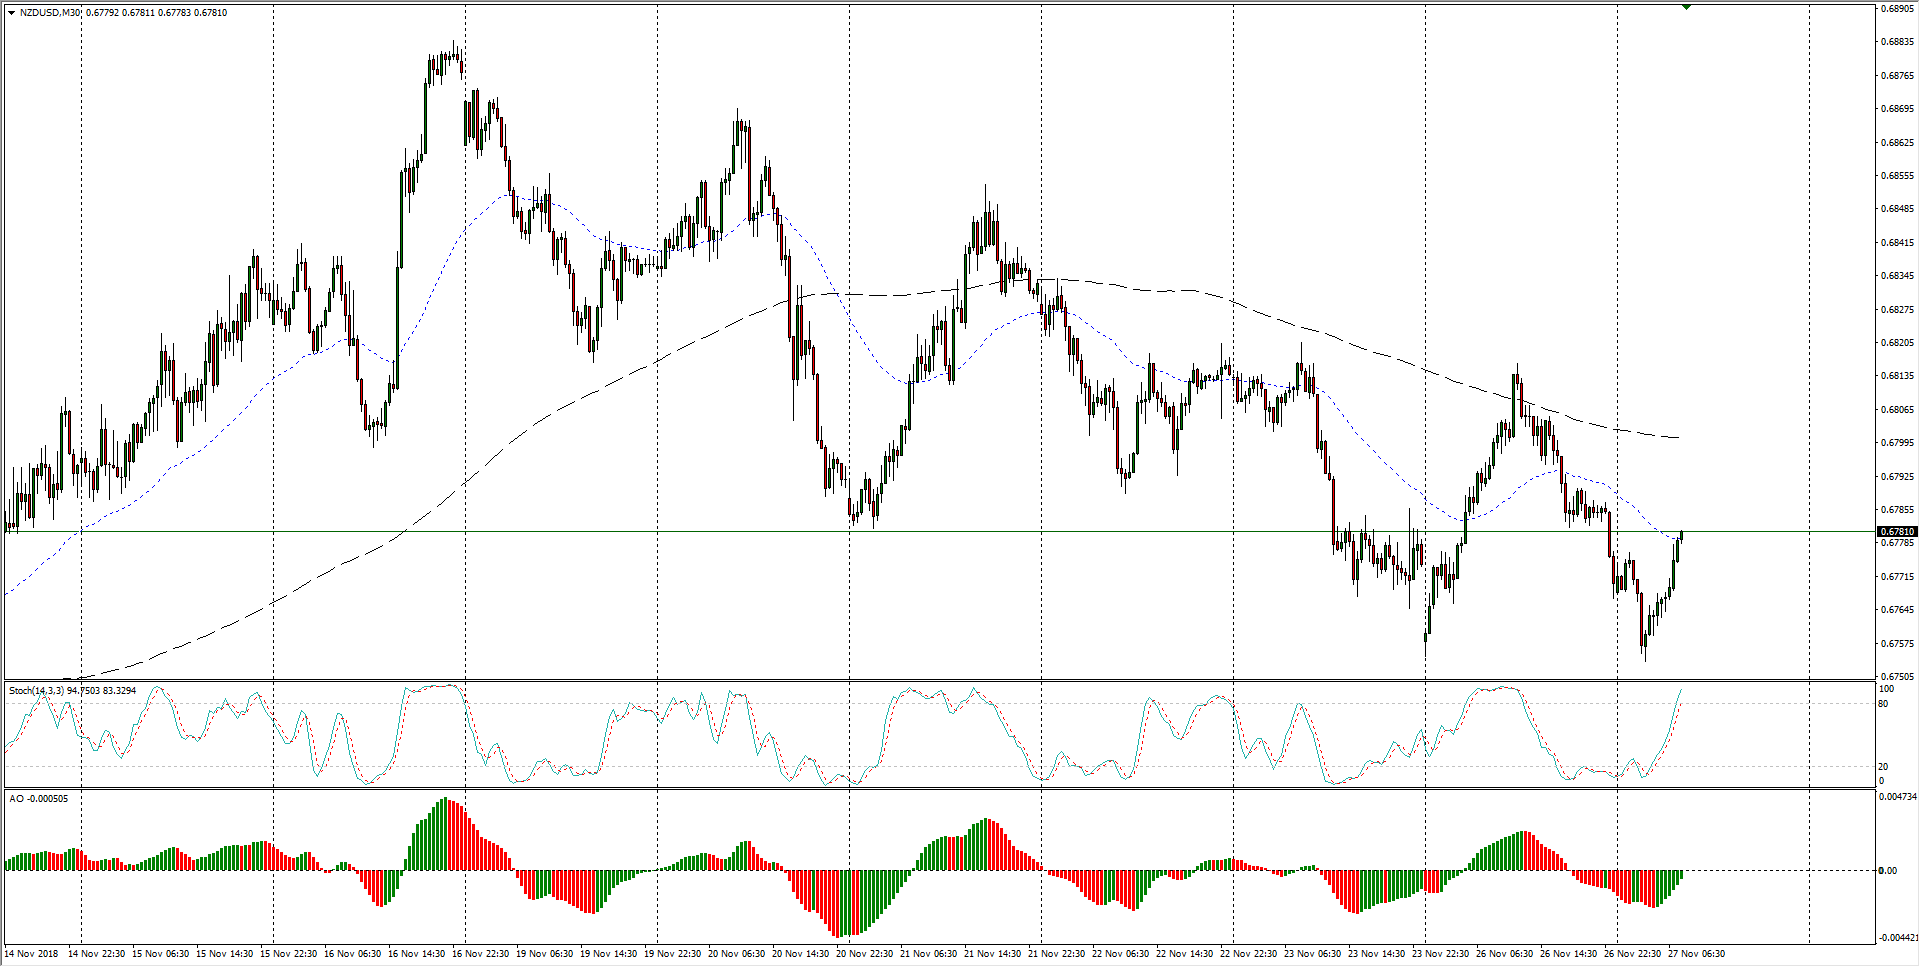
- The past two weeks shows the Kiwi steadily cycling lower in large swings, marking out a rough channel that threatens to lose momentum from a lateral swing low at the 0.6750 level.
NZD/USD Chart, 30-Minute
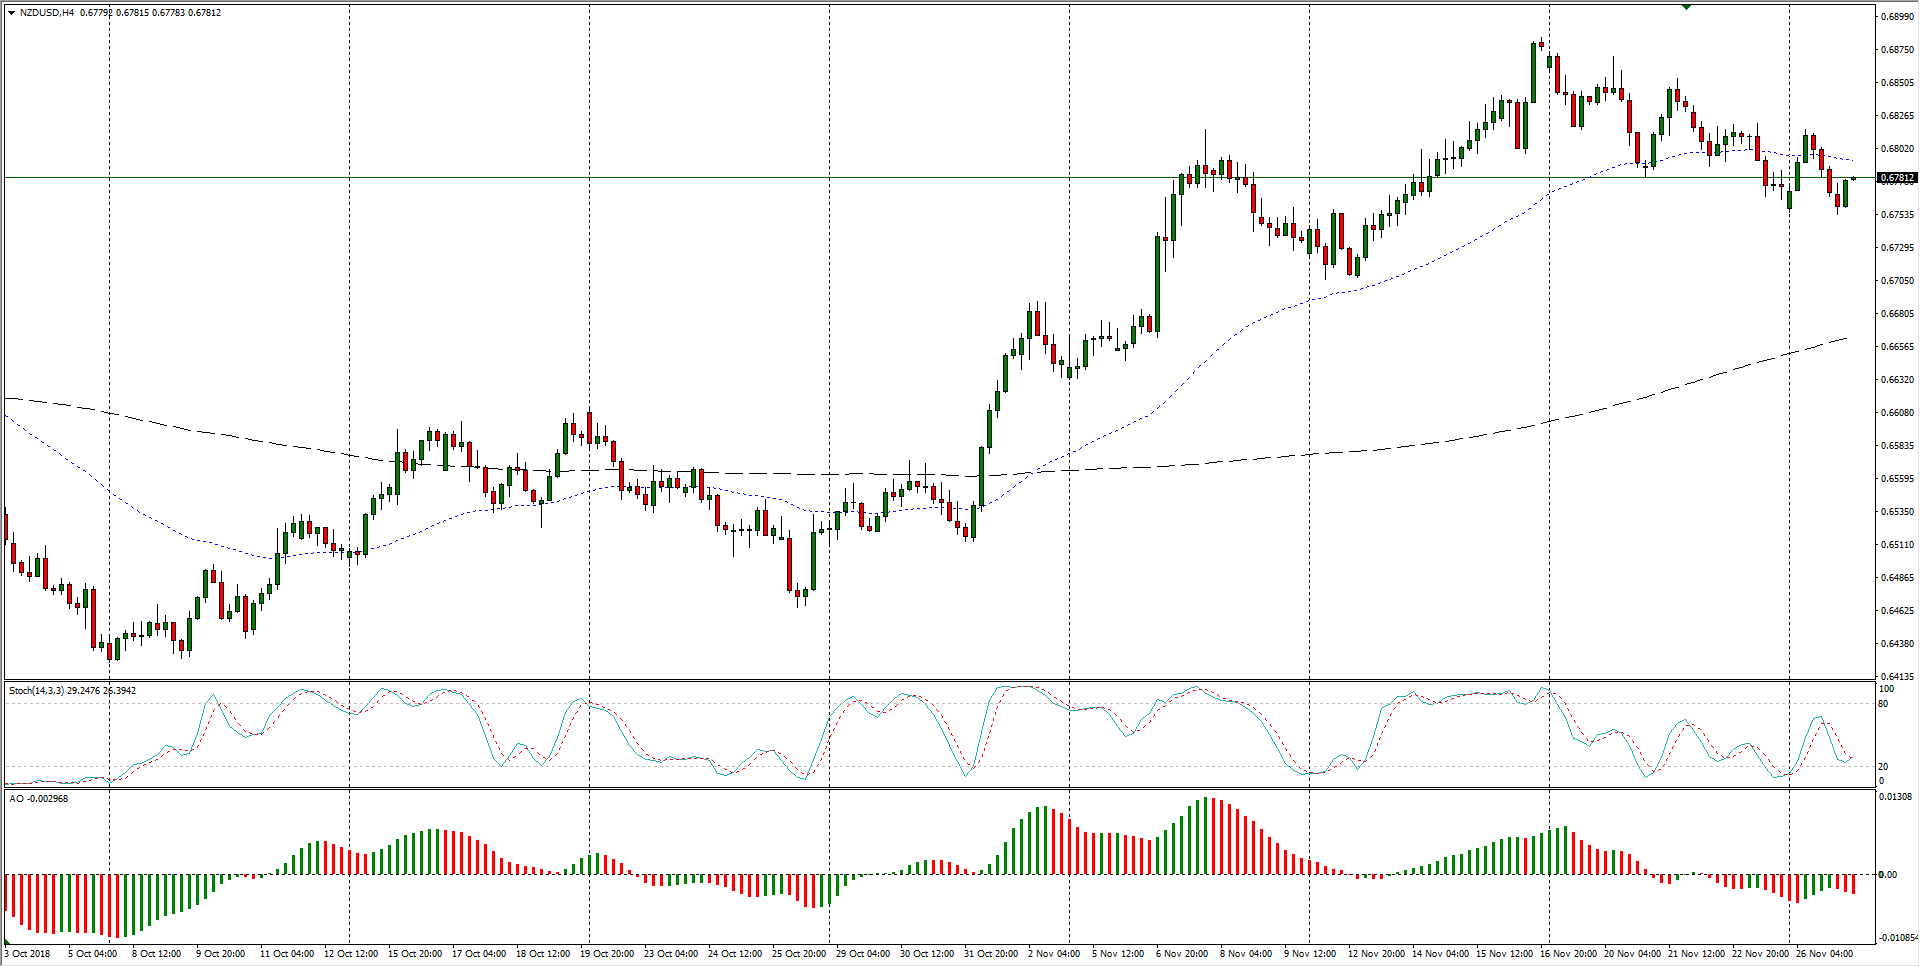
- The past two months have seen the NZD/USD pair recover from medium-term lows at the 0.6440 level, but the last move towards the upside appears to have run out of momentum as the Kiwi becomes entangled in the 50-period moving average at the 0.6800 handle.
NZD/USD, 4-Hour
NZD/USD
Overview:
Today Last Price: 0.6778
Today Daily change: -7.0 pips
Today Daily change %: -0.103%
Today Daily Open: 0.6785
Trends:
Previous Daily SMA20: 0.674
Previous Daily SMA50: 0.6632
Previous Daily SMA100: 0.6659
Previous Daily SMA200: 0.6877
Levels:
Previous Daily High: 0.6818
Previous Daily Low: 0.6756
Previous Weekly High: 0.6876
Previous Weekly Low: 0.6767
Previous Monthly High: 0.663
Previous Monthly Low: 0.6424
Previous Daily Fibonacci 38.2%: 0.6779
Previous Daily Fibonacci 61.8%: 0.6794
Previous Daily Pivot Point S1: 0.6755
Previous Daily Pivot Point S2: 0.6724
Previous Daily Pivot Point S3: 0.6693
Previous Daily Pivot Point R1: 0.6816
Previous Daily Pivot Point R2: 0.6848
Previous Daily Pivot Point R3: 0.6878
