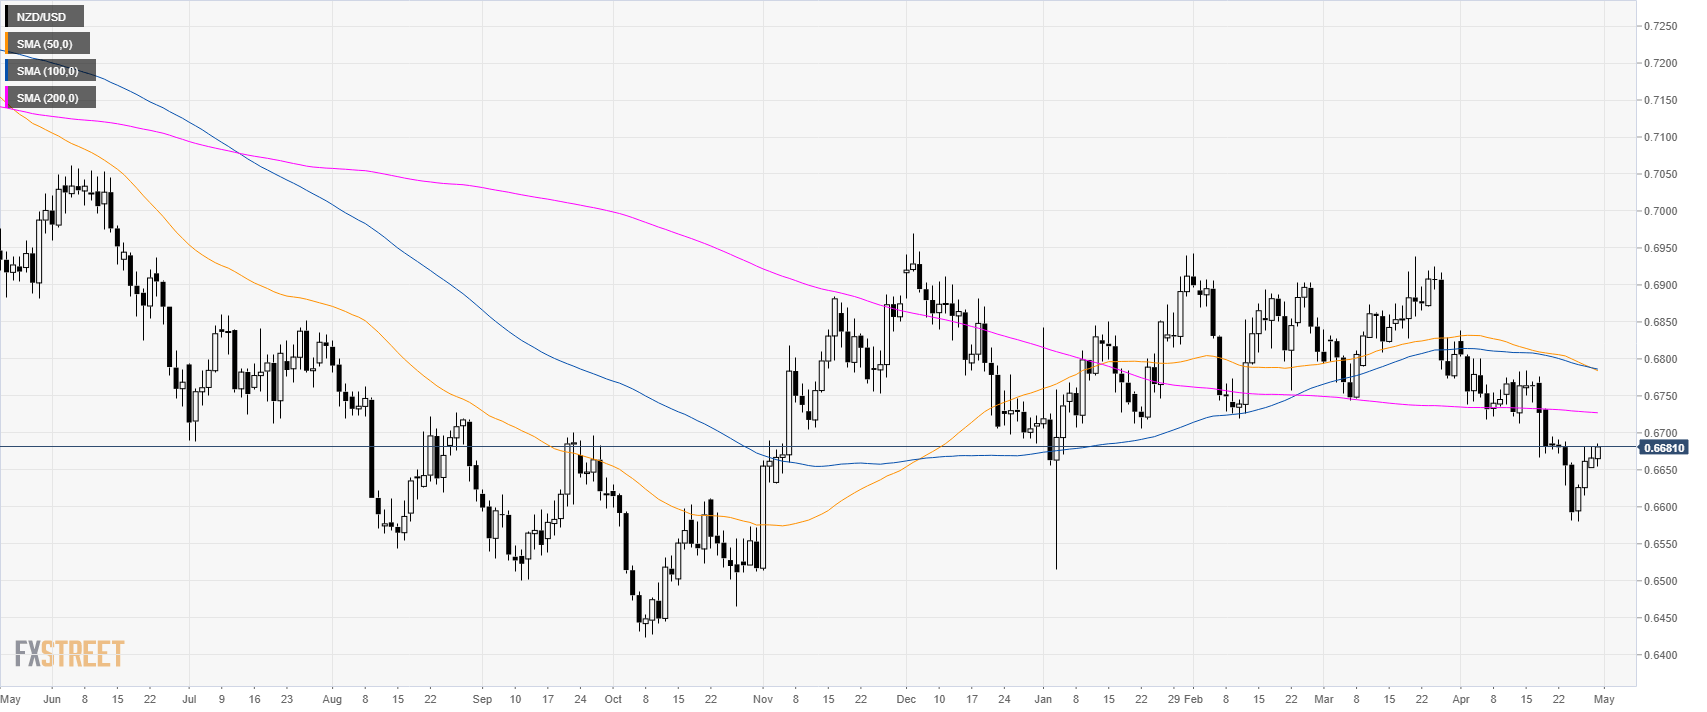
NZD/USD daily chart
- NZD/USD is trading in a bear leg below its 200-day simple moving average (SMA).
- The New Zealand quarterly employment data at 22:45 GMT can lead to high volatility in NZD-related currency pairs.
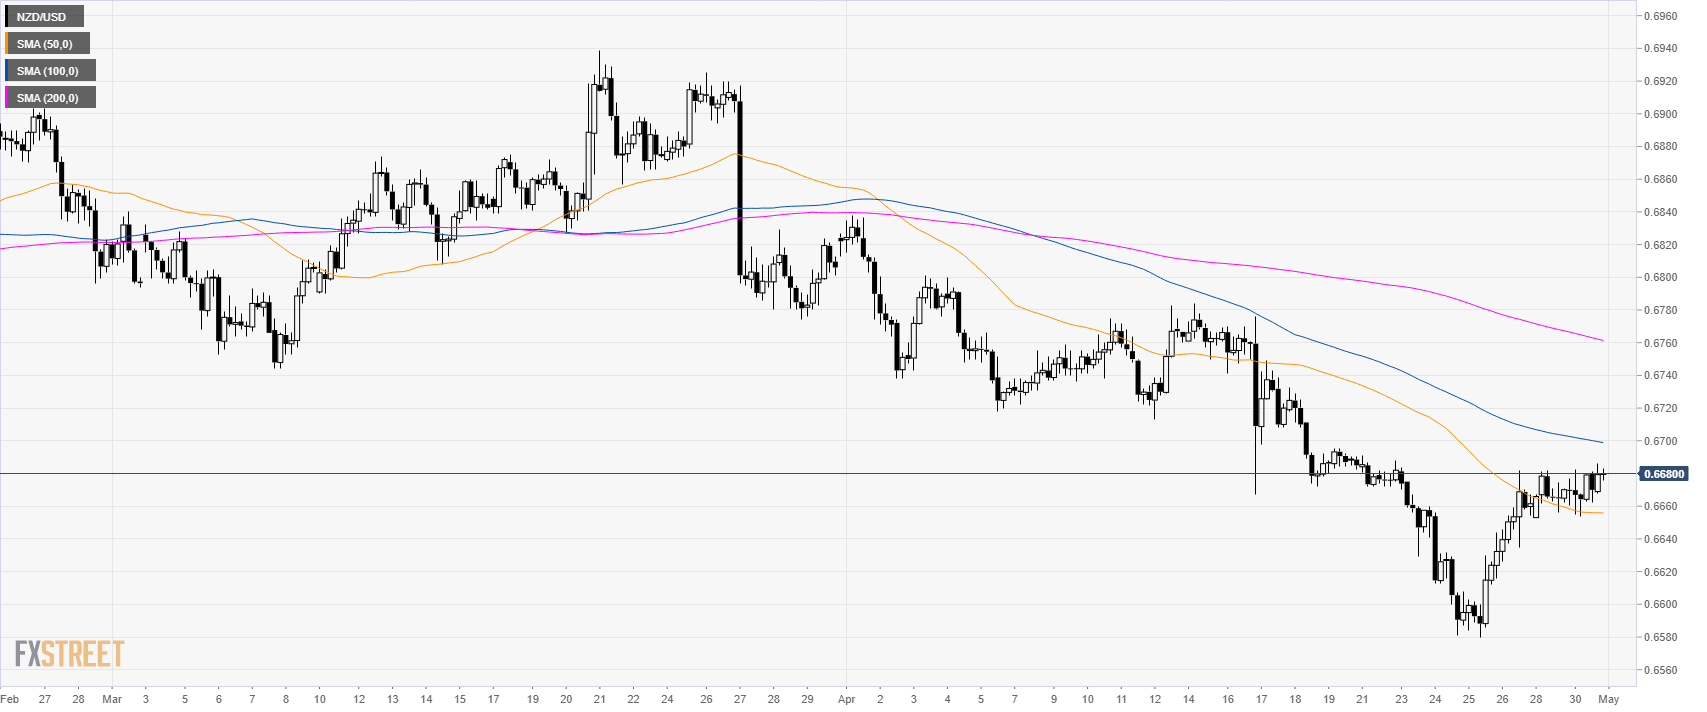
NZD/USD 4-hour chart
- NZD/USD is trading above its 50 SMA suggesting a consolidation in the medium-term.
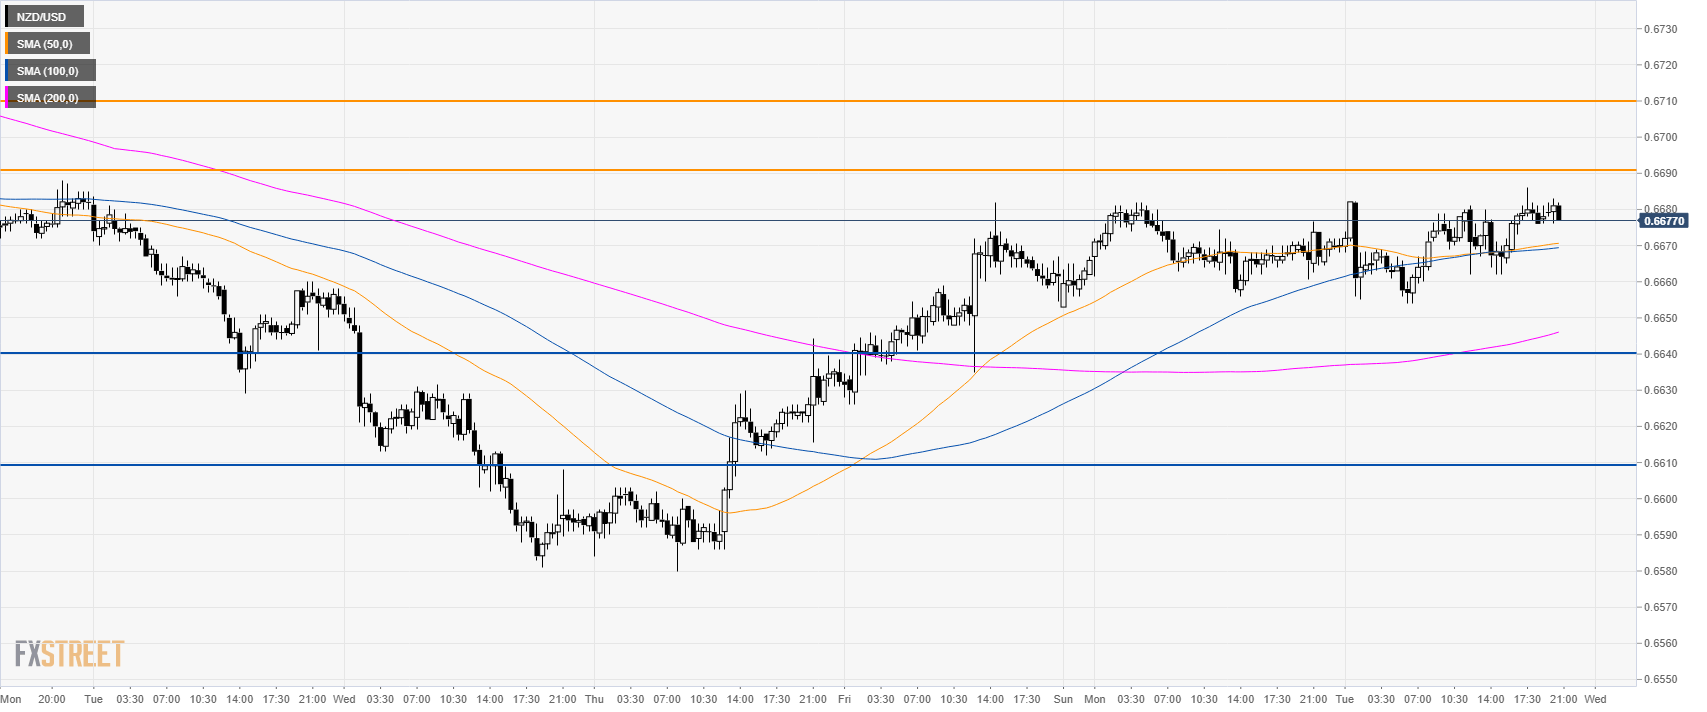
NZD/USD 30-minute chart
- NZD/USD is trading above its main SMAs suggesting a bullish bias in the short-term.
- Bulls need a break above 0.6690 to reach 0.6710, 0.6740 and 0.6770 to the upside.
- Support is at 0.6640 and 0.6610 level.
Additional key levels
