- NZD/USD has hit the lowest level since September 2015.
- The bearish lower highs setup and the daily chart indicators suggest the path of least resistance is to the downside.
The NZD/USD pair is currently trading at 0.6238 – the lowest level since September 2015.
The currency pair fell by 6.77% in the third quarter. That was the biggest quarterly loss since the second quarter of 2015. Back then, the Kiwi had dropped by more than 9.5%.
The sell-off seen in the last few hours could be associated with the dismal New Zealand data and the resulting rise in the bets that the Reserve Bank of New Zealand will cut rates in November and February.
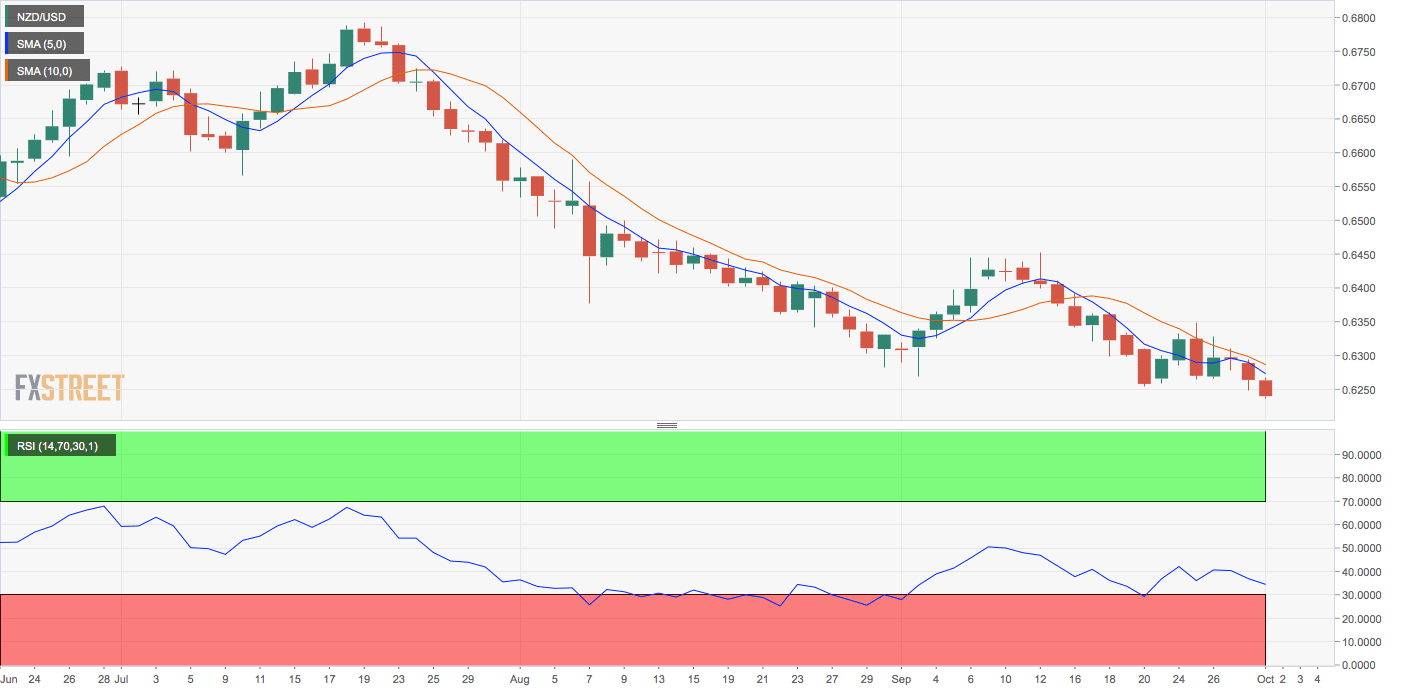
The pair may slide further, as the 14-day relative strength index (RSI) is reporting bearish conditions with a below-50 print. Also, the 5- and 10-day moving averages (MAs) are trending south, indicating a bearish setup.
The outlook would turn bullish if and when the pair violates the bearish lower highs pattern with a move above Sept. 12’s high of 0.6451.
Daily chart
Trend: Bearish
Technical levels
