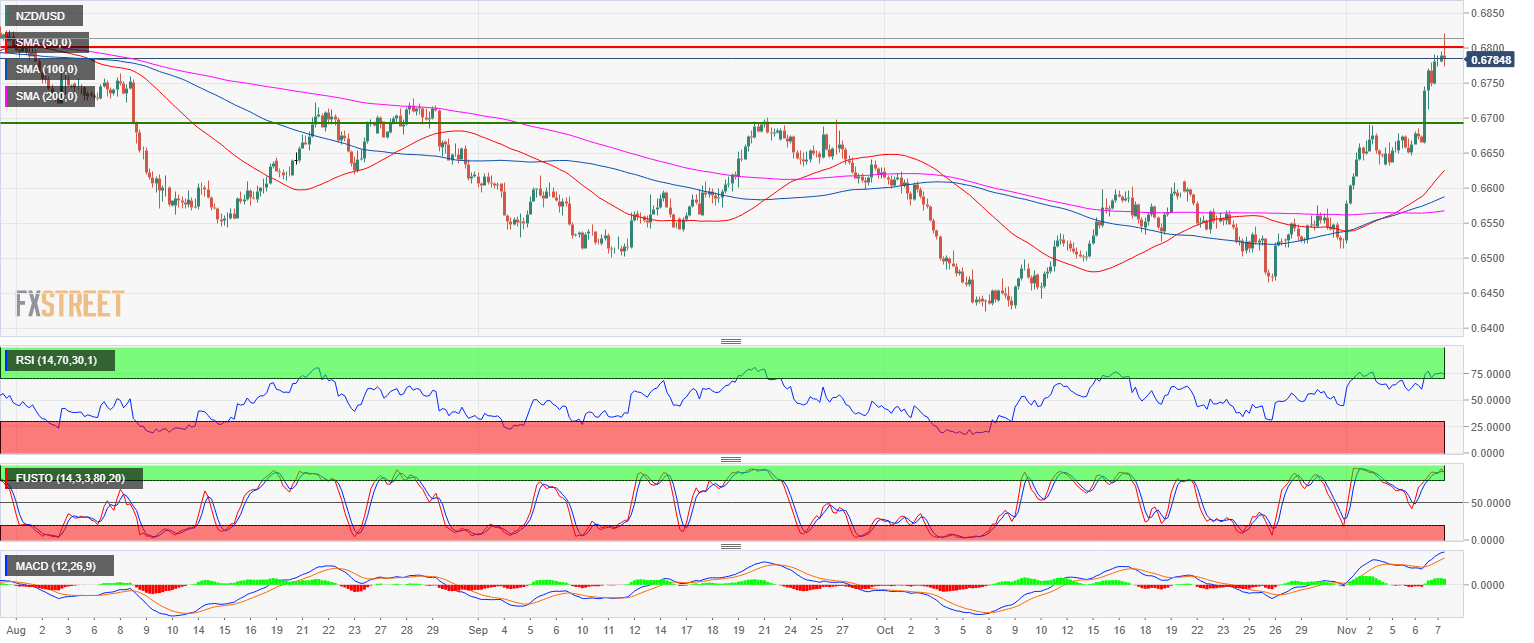
- NZD/USD is trading in a bull trend above the 200-period simple moving average on the 4-hour chart.
- NZD/USD found resistance near the 0.6800 resistance after the RBNZ (Reserve Bank of New Zealand) left interest rates unchanged at 1.75%. While the trend is bullish the bulls might have overextended themselves with technical indicators in oversold conditions.
- Supports to the downside can be seen near 0.6750 and 0.6700 figure.
NZD/USD 4-hour chart
NZD/USD
Overview:
Last Price: 0.6784
Daily change: 1.1e+2 pips
Daily change: 1.71%
Daily Open: 0.667
Trends:
Daily SMA20: 0.656
Daily SMA50: 0.6574
Daily SMA100: 0.6662
Daily SMA200: 0.6913
Levels:
Daily High: 0.6684
Daily Low: 0.6646
Weekly High: 0.669
Weekly Low: 0.6513
Monthly High: 0.663
Monthly Low: 0.6424
Daily Fibonacci 38.2%: 0.667
Daily Fibonacci 61.8%: 0.6661
Daily Pivot Point S1: 0.6649
Daily Pivot Point S2: 0.6628
Daily Pivot Point S3: 0.6611
Daily Pivot Point R1: 0.6688
Daily Pivot Point R2: 0.6705
Daily Pivot Point R3: 0.6726
