- RSI close to overbought conditions, failure to extend run-up after key resistance break show buyers’ exhaustion.
- Pair’s rise beyond 0.6763/65 enables it to target 13-week high.
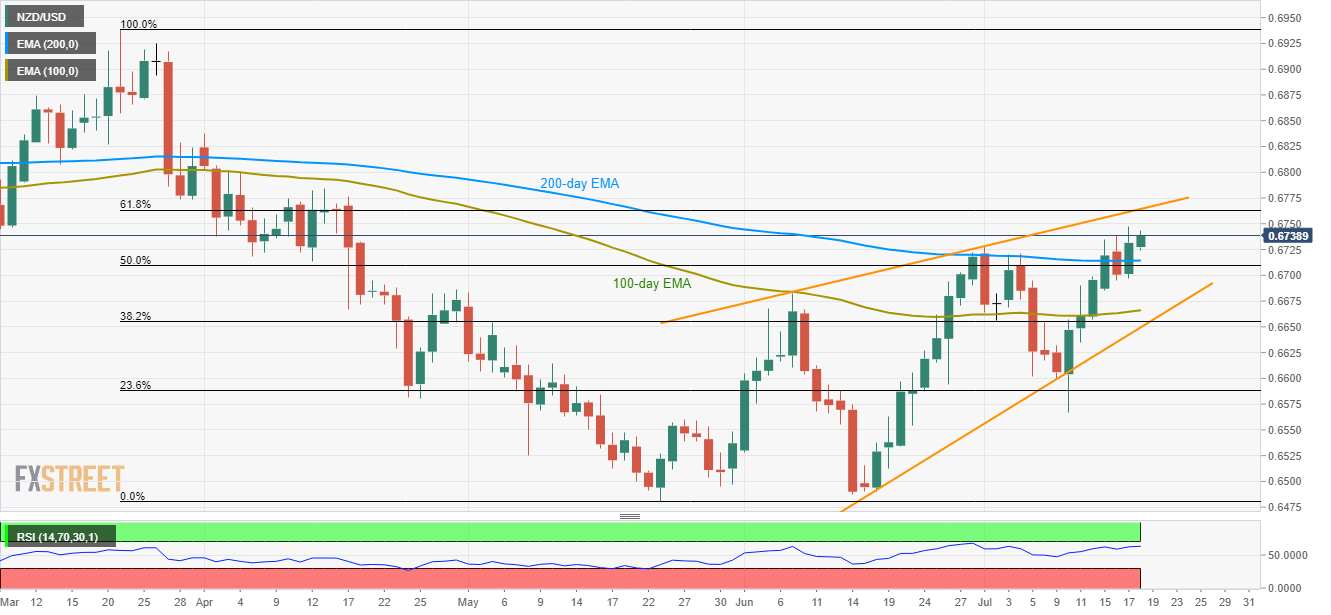
Given the failures to rise much above 200-day EMA, NZD/USD takes the rounds to 0.6740 during early Thursday.
Not only its recent pullback even after clearing key resistance (now support), close to overbought conditions of 14-day relative strength index (RSI) also questions that pair’s strength. As a result, the 0.6763/65 confluence comprising 61.8% Fibonacci retracement of March-May declines and upper-line of 1.5-month-old “rising wedge” technical formation, could keep limiting the pair’s advances.
In doing so, pair’s pullbacks to 200-day exponential moving average (EMA) level of 0.6715 and then to 0.6700 round-figure can be expected. However, 100-day EMA at 0.6667 and pattern support at 0.6650 could confine pair’s downside below 0.6700, if not then the bearish formation gets confirmed, which in turn open the gates for the pair’s south-run to May month bottom near 0.6480.
On the upside, a successful break of 0.6765 enables buyers to target mid-April tops adjacent to 0.6785 and then expect a rise towards 0.6800 round-figure.
During the quote’s additional rise past-0.6800, 0.6840 and 0.6870 can offer intermediate stops to the rally aiming at March high around 0.6940.
NZD/USD daily chart
Trend: Pullback expected
