- NZD/USD holds beyond 0.6400 ever since it reversed from it before two weeks.
- 10-DMA and May/June low limit near-term upside.
Despite repeated bounces off 0.6400, NZD/USD remains below near-term key resistances as it takes the rounds to 0.6415 during early Wednesday.
With this, the pair keeps being titled towards 0.6400 whereas a break of which can drag it back to monthly low at 0.6378.
If prices slip beneath 0.6378, the year 2016 low near 0.6348 could lure sellers.
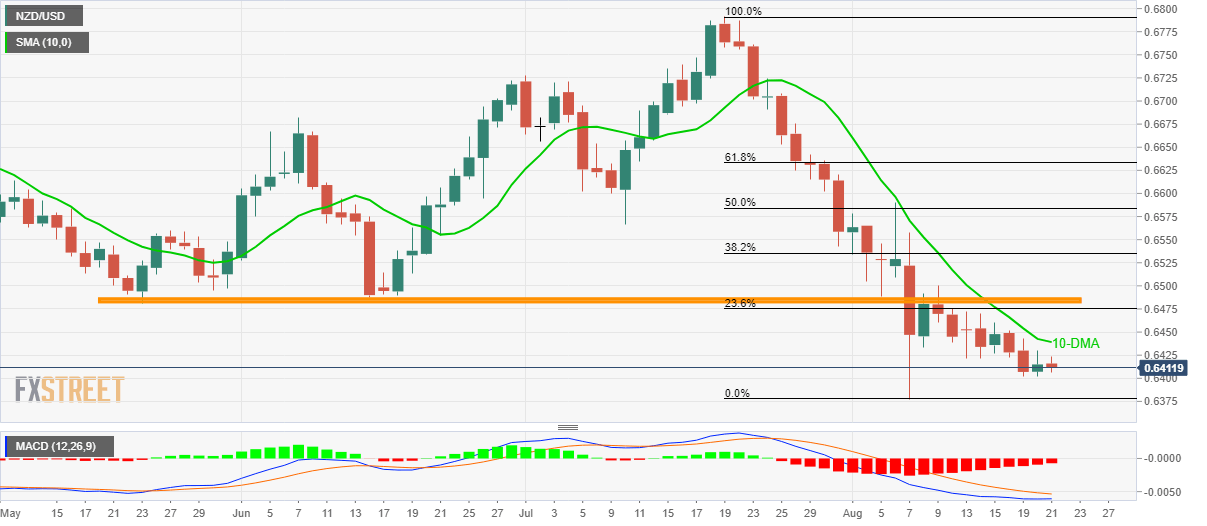
On the upside, 10-day simple moving average (DMA) near 0.6440 and an area comprising lows marked in May and June, surrounding 0.6480/90 becomes key resistances to observe.
In a case where buyers manage to conquer 0.6490, 38.2% Fibonacci retracement of its July- August declines at 0.6536 will come back on the chart.
NZD/USD daily chart
Trend: Bearish
