Home NZD/USD Technical Analysis: Slide to weekly lows exposes lower bound of range
FXStreet News

NZD/USD Technical Analysis: Slide to weekly lows exposes lower bound of range

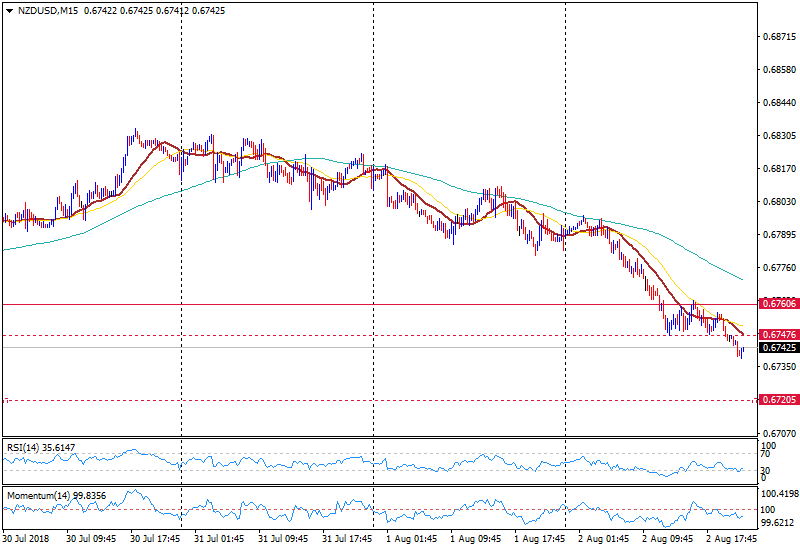
  • Pair looking for a support zone, after accelerating to the downside; bearish pressure to persists while below 0.6760.  
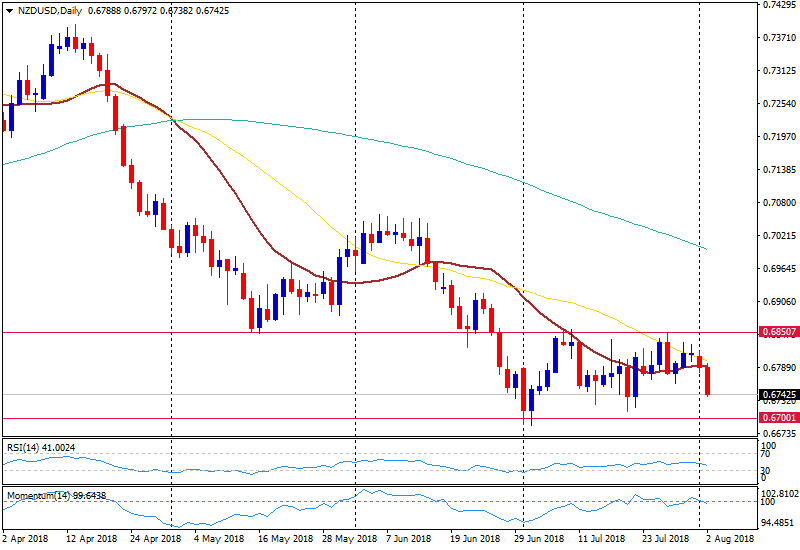
  •  On the daily chart still moves in a wide range, but close to a key support: current weakness, if persists, likely to open the doors for a test of 0.6700/20, key support area.  
  • A daily close above 0.6850 would negate the current bearish bias and signal more gains ahead.

NZD/USD 15-minute chart

NZD/USD 15

NZD/USD Daily chart

NZD/USD D

Spot rate:                   0.6742
High:                         0.6797
Low:                          0.6738

Trend:                        Sideways

Resistance 1:            0.6760
Resistance 2:            0.6800
Resistance 3:            0.6830

Support 1:                0.6725
Support 2:                0.6685
Support 3:                0.6660

FX Street

FX Street

FXStreet is the leading independent portal dedicated to the Foreign Exchange (Forex) market. It was launched in 2000 and the portal has always been proud of their unyielding commitment to provide objective and unbiased information, to enable their users to take better and more confident decisions.