Home NZD/USD suffers consistent decline
Forex News Today: Daily Trading News

NZD/USD suffers consistent decline

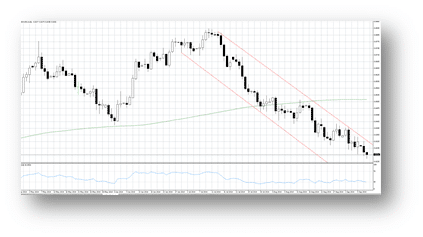
A daily candlestick chart of the NZD/USD currency pair appears above illustrating the consistent decline within its notable medium term down channel with upper and lower trendlines drawn in red. The rate continues to extend its divergence below its falling 200 day Moving Average shown in green, and its 14 day RSI appears in blue in the indicator box just above oversold territory.

The Kiwi made another fresh recent low at the 0.8248 level this morning, as its trades between the falling upper trendline of its medium term down channel now drawn at the 0.8329 level and its parallel lower support line drawn at 0.8100. Its 14 day RSI has fallen to just above oversold territory at the 30.26 level, and the Kiwi remains below its flat 200 day MA still at 0.8515. Support is noted at 0.8248, with resistance seen in the 0.8285/89 region and at 0.8309. The outlook is now bearish in the near term and medium terms.
NZDUSD September 9 2014 technical analysis new zealand dollar USD


Jay Hawk

Jay Hawk

Jay Hawk of Orbex enjoyed a twelve year professional financial markets career incorporating extensive first hand futures and options experience obtained by trading in the stock, commodity and forex markets on U.S. exchanges. Jay Hawk personally leased seats and traded as a specialist market-maker with a broker/dealer license on major U.S. trading floors. He also ran stock and options broking desks with hundreds of retail and professional accounts, and I actively managed trading portfolios for private clients as large as $30 million both on and off the trading floors. In addition, Jay started a professional options stock exchange brokerage to provide brokerage services on to floor market-makers and upstairs traders located in New York and Chicago. Jay also gave option seminars as both a consultant and educator and helped start the exchange traded currency options market.