- WTI is slowly advancing as buyers are defending the 59.00 handle.
- The level to beat for bulls is the 60.00 big figure.
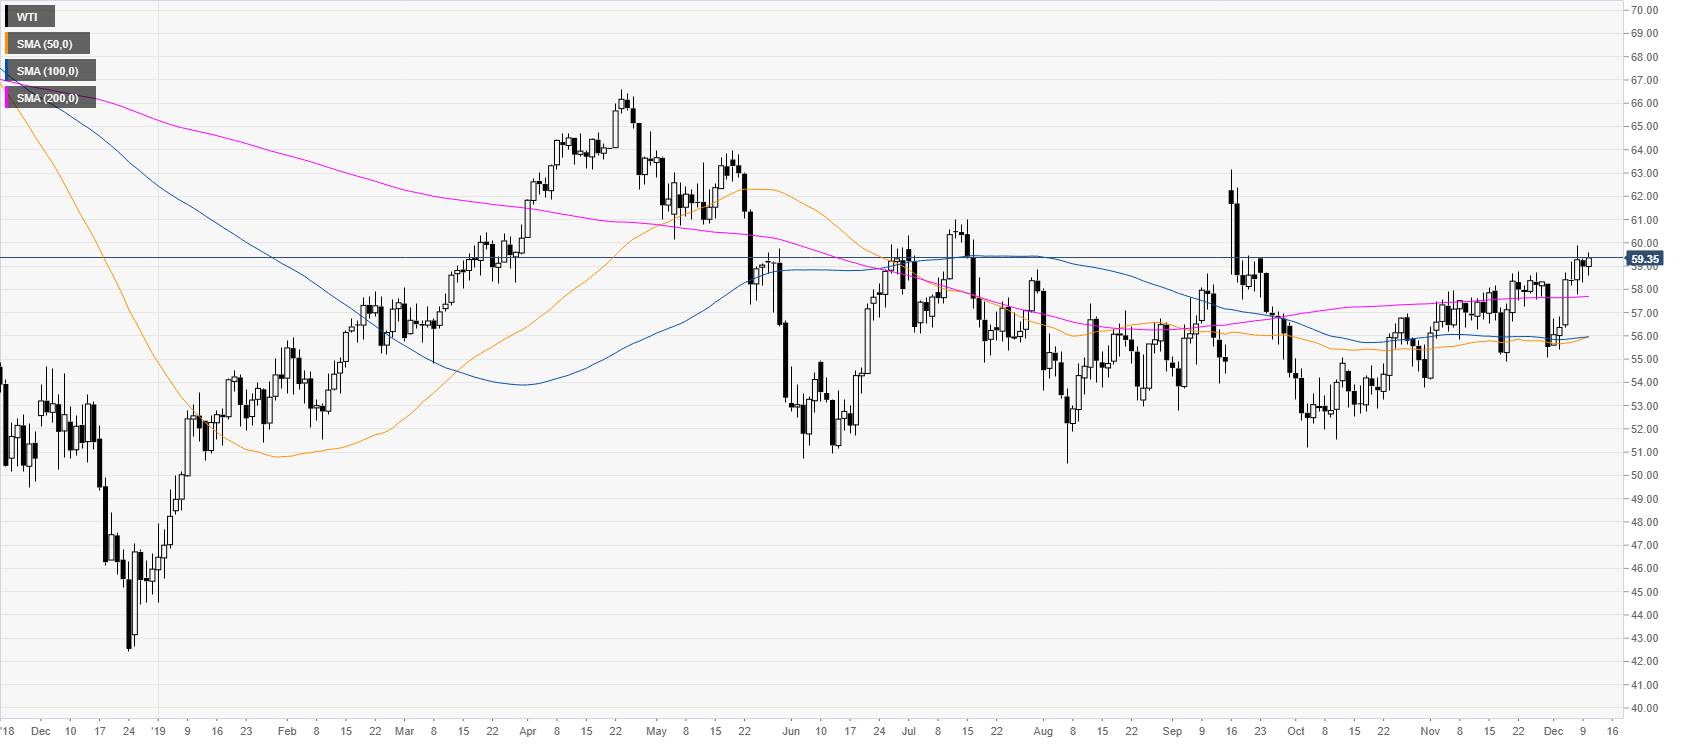
Crude oil daily chart
The crude oil West Texas Intermediate (WTI) is currently trading above $59.00 a barrel and the main daily simple moving averages (DMAs). The market is trading within the range of the last six months.
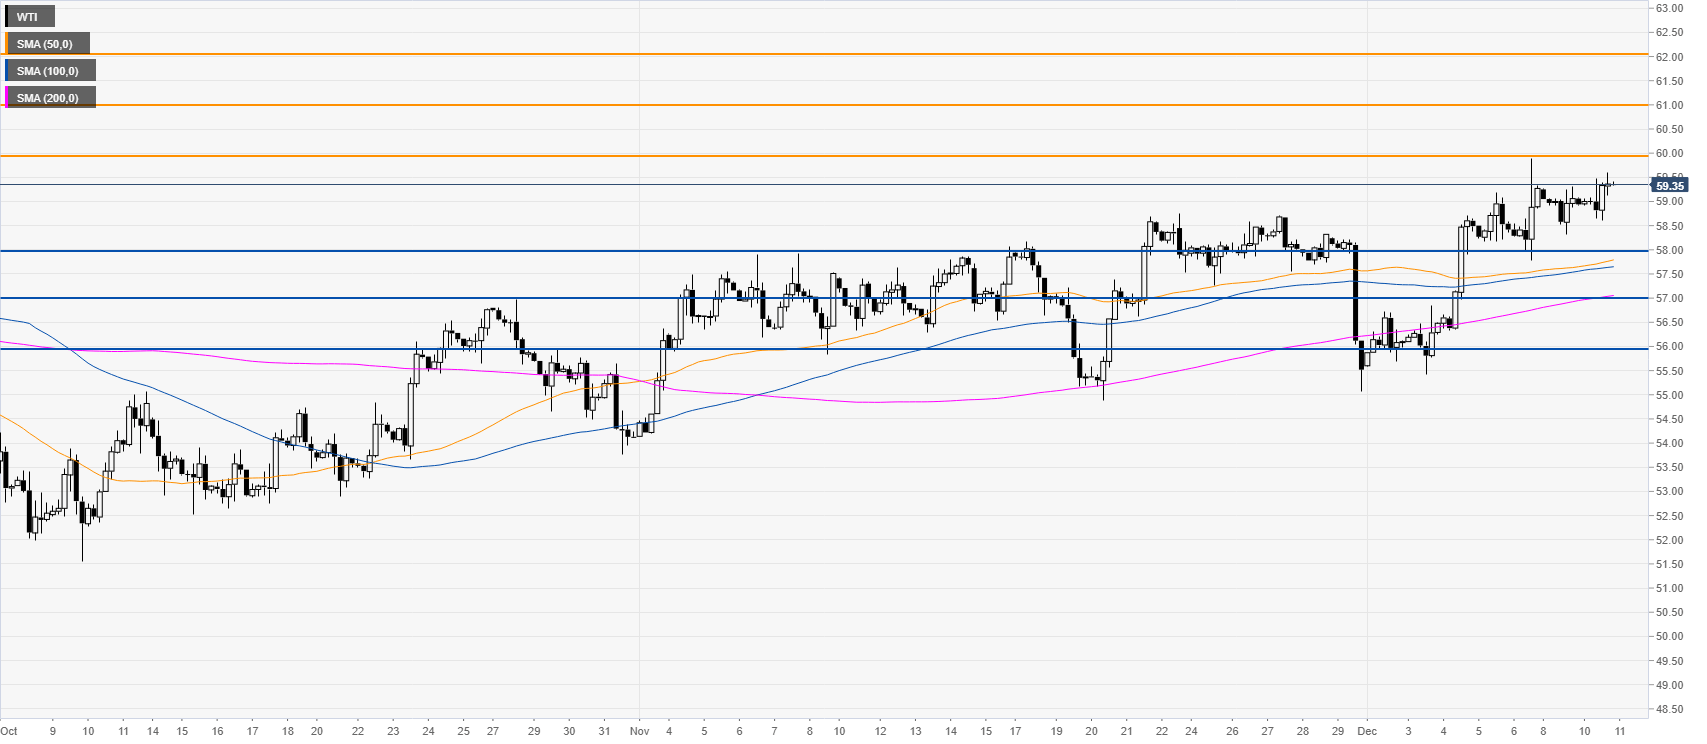
Crude oil four-hour chart
Black gold is grinding up above its main SMAs on the four-hour chart, suggesting a bullish bias in the medium term. As the underlying trend is bullish, the buyers would likely take a chance on a break above the 60 handle to reach the 61.00 and 62.00 levels on the way up.
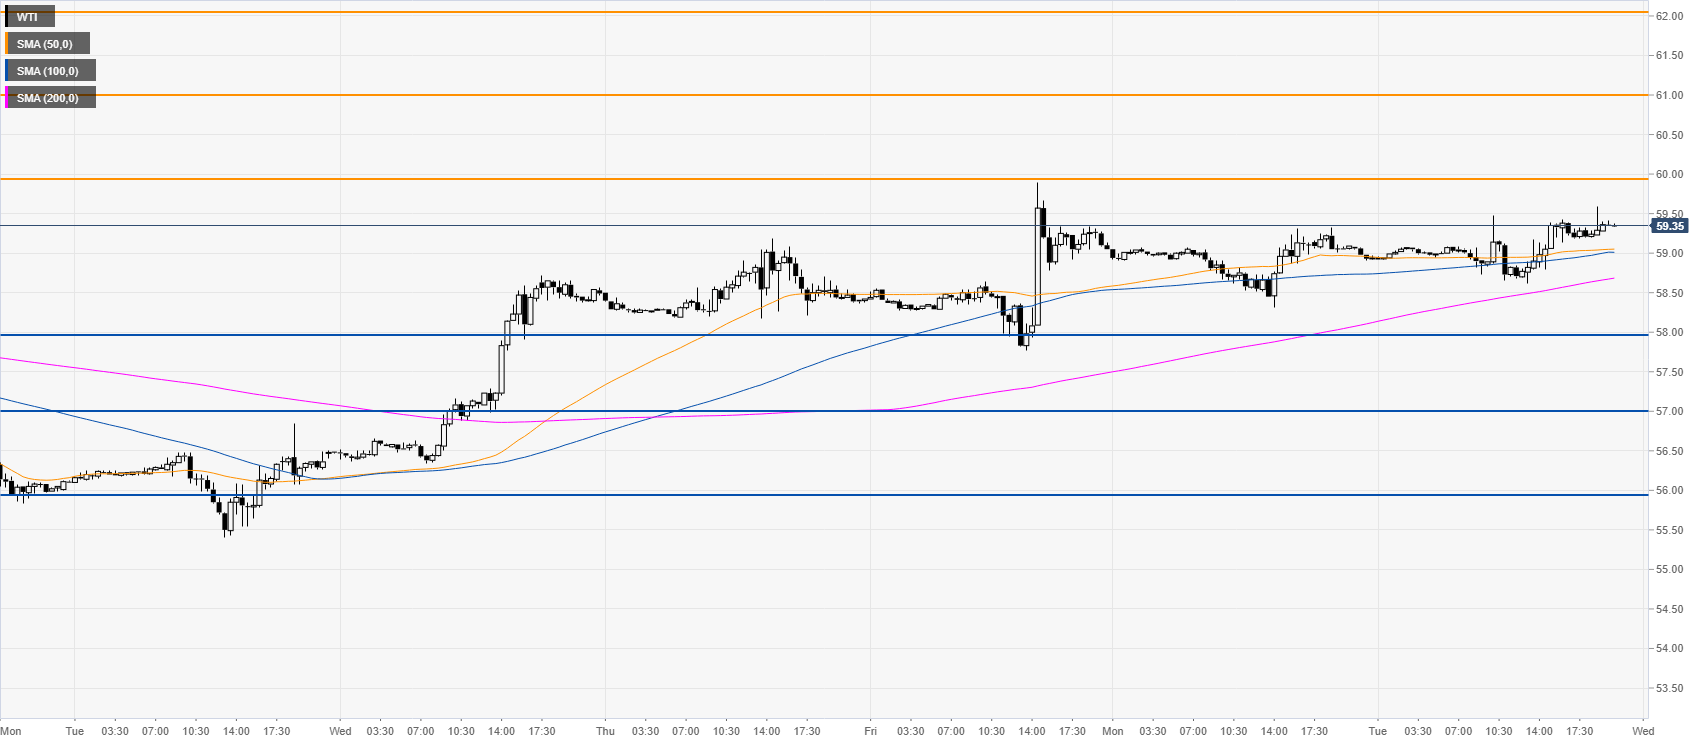
Crude oil 30-minute chart
WTI bulls are maintaining the upper hand while the market trades above the main SMAs. Support is seen at the 58.00, 57.00 and 56.00 price levels.
Additional key levels
