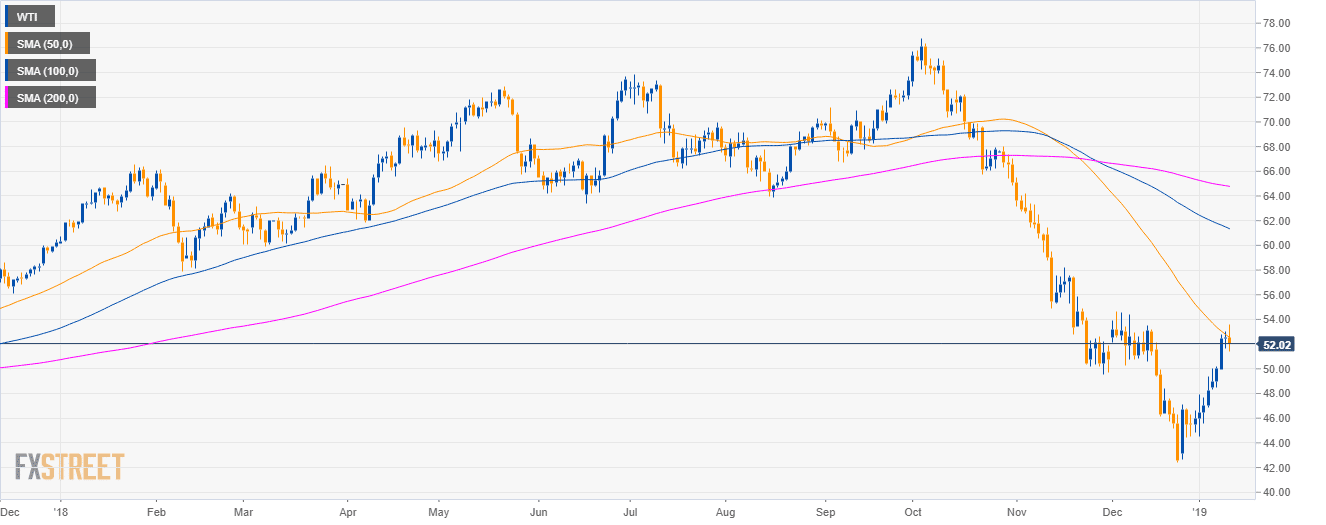
Oil daily chart
- Crude oil WTI is trading in a bear trend below the 200-period simple moving average (SMA).
- Bulls are testing the 50 SMA.
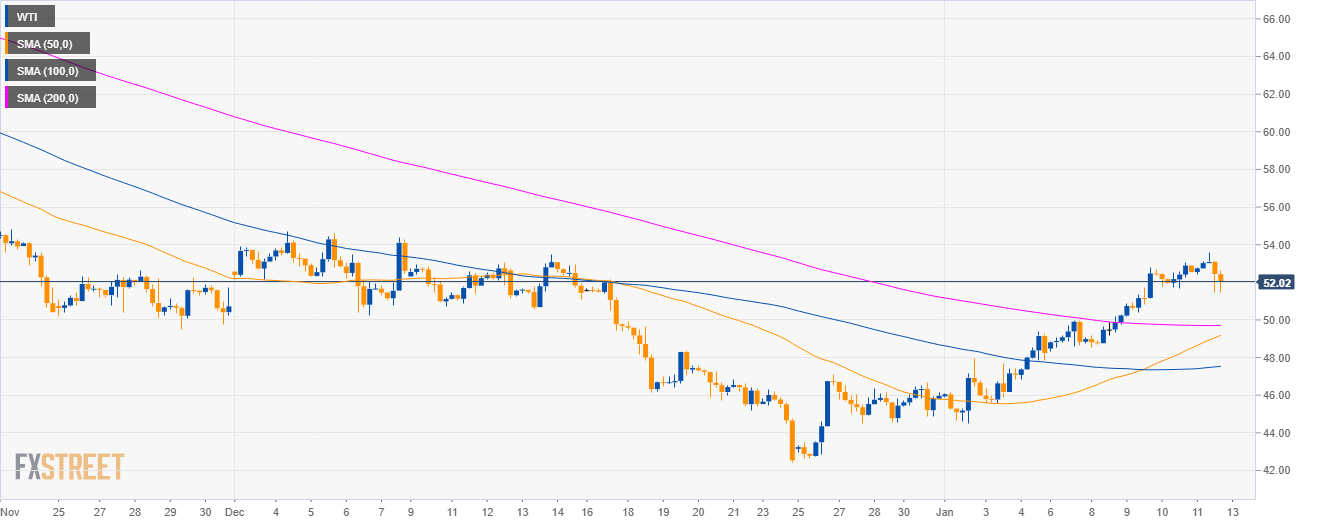
Oil 4-hour chart
- Bulls have regained the main SMAs suggesting bullish momentum in the medium-term.
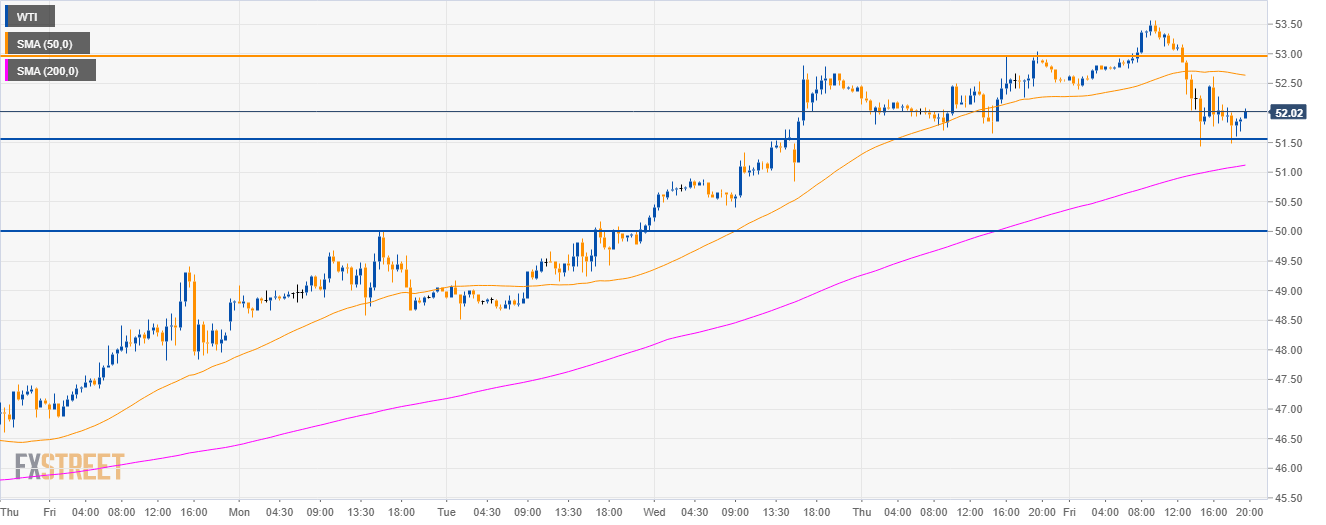
Gold 30-minute chart
- As forecast 51.50 is acting as support.
- A break below the level can lead to a breakdown to $50.00 a barrel in the coming sessions.
Additional key levels
WTI
Overview:
Today Last Price: 52.02
Today Daily change: -54 pips
Today Daily change %: -1.03%
Today Daily Open: 52.56
Trends:
Previous Daily SMA20: 48.14
Previous Daily SMA50: 51.86
Previous Daily SMA100: 60.88
Previous Daily SMA200: 64.79
Levels:
Previous Daily High: 53.03
Previous Daily Low: 51.66
Previous Weekly High: 49.41
Previous Weekly Low: 44.52
Previous Monthly High: 54.68
Previous Monthly Low: 42.45
Previous Daily Fibonacci 38.2%: 52.51
Previous Daily Fibonacci 61.8%: 52.18
Previous Daily Pivot Point S1: 51.8
Previous Daily Pivot Point S2: 51.05
Previous Daily Pivot Point S3: 50.43
Previous Daily Pivot Point R1: 53.17
Previous Daily Pivot Point R2: 53.79
Previous Daily Pivot Point R3: 54.54
