- Brent oil recovery could fall apart if prices drop below $74.40 (ascending trendline support on the hourly chart).
- A break below $74.40 would also add credence to lower price highs and lower price lows seen in the hourly chart and would indicate the rally from the July 17 low of $71.26 has ended and the bears have taken over.
Hourly chart
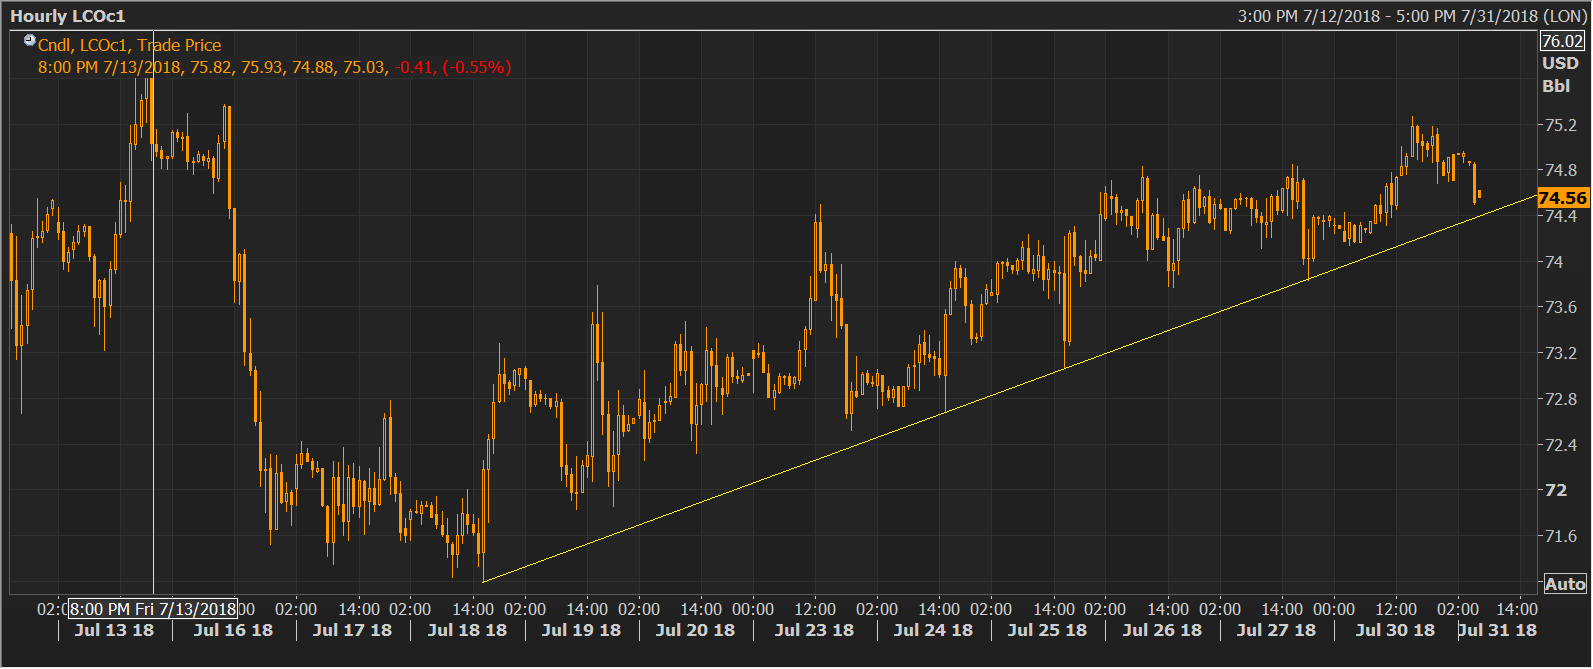
Current Price: $74.56
Daily High: $75.09
Daily Low: $74.50
Trend: Bearish below $74.40
R1: $75.26 (previous day’s high)
R2: $75.99 (July 13 high)
$3: $76.47 (July 6 low)
Support
S1: $74.40 (rising trendline support)
S2: $73.83 (Support on the hourly chart)
S3: $71.26 (recent low)
