- Crude oil had its largest weekly drop last week as the stockpile data showed an unexpected excess.
- WTI is now consolidating the losses above $58.00 a barrel.
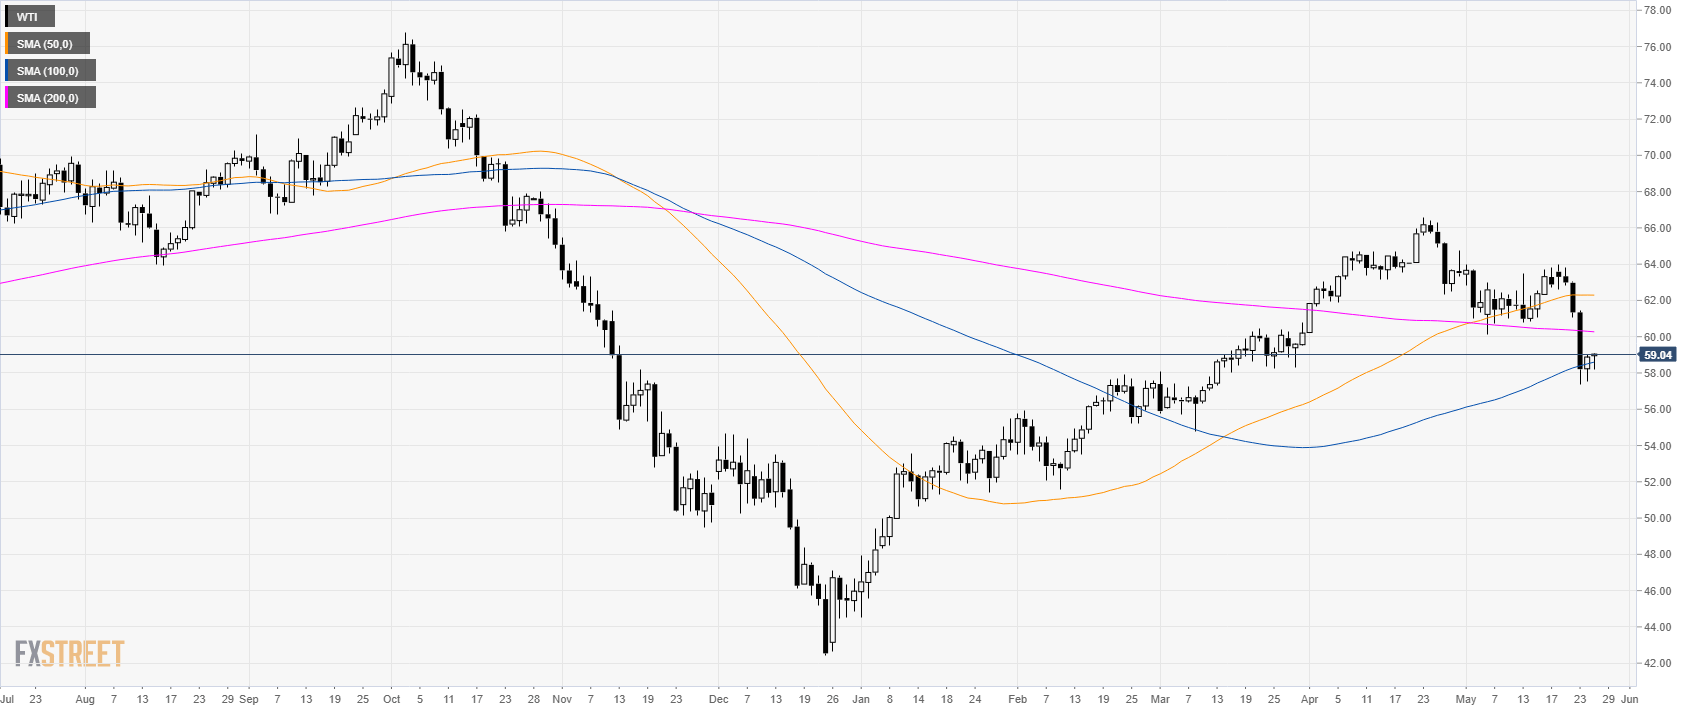
Oil daily chart
On the daily chart, WTI (West Texas Intermediate) is currently trading below its 50 and 200 simple moving averages (SMAs) while holding just above the 100 SMA.
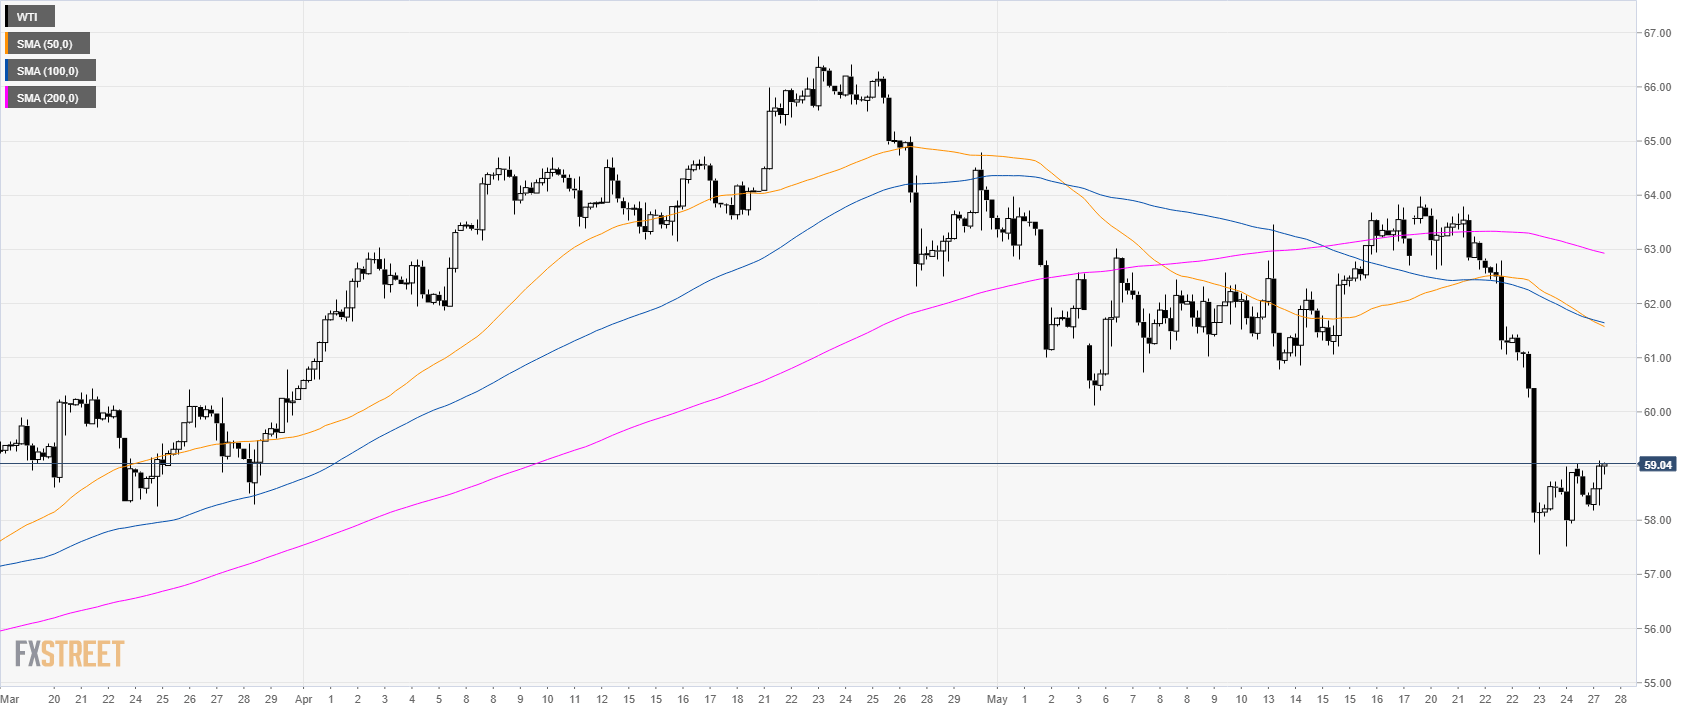
Oil 4-hour chart
WTI is consolidating the recent losses just above the 58.00 level and below its main SMAs.
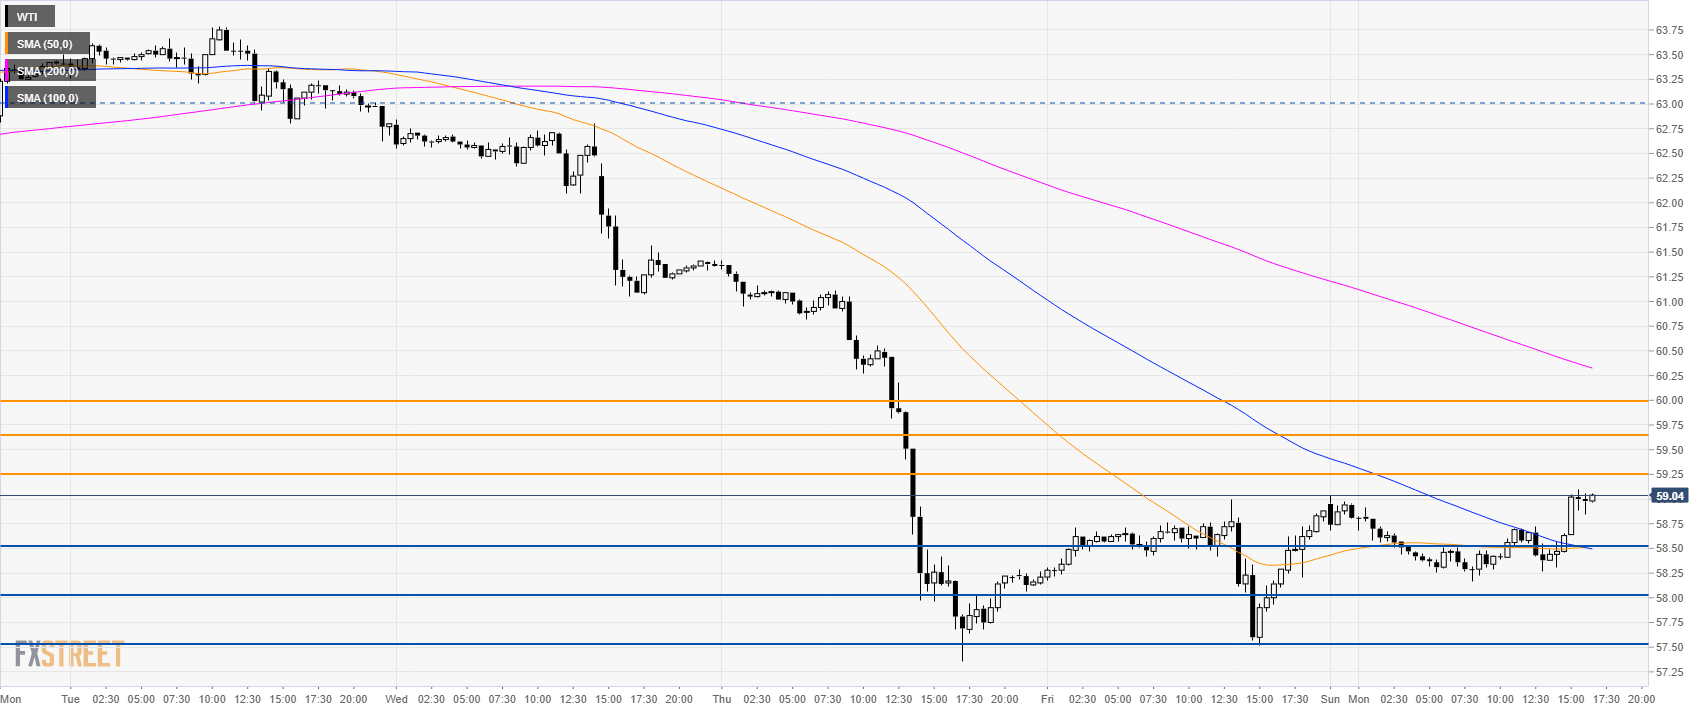
Oil 30-minute chart
Bulls are trading near the daily high challenging the 59.00 figure while trading above the 50 and 100 SMAs. A break above 59.25 can see bulls retake 59.65 and $60.00 a barrel. Support is seen at 58.50, 58.00 and 57.50 levels.
Additional key levels
