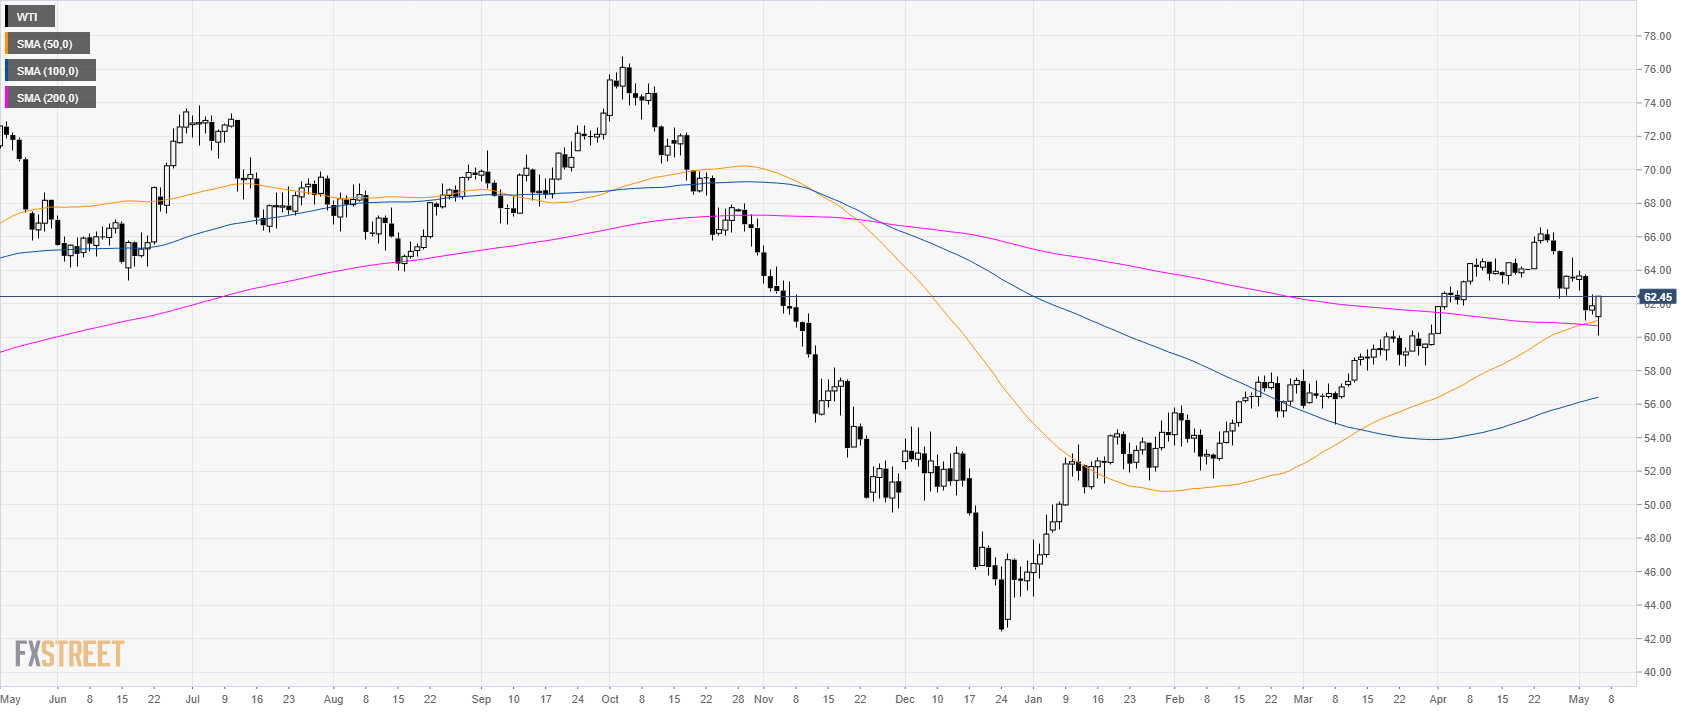
Oil daily chart
- WTI is trading in a bull trend above its main simple moving averages (SMAs).
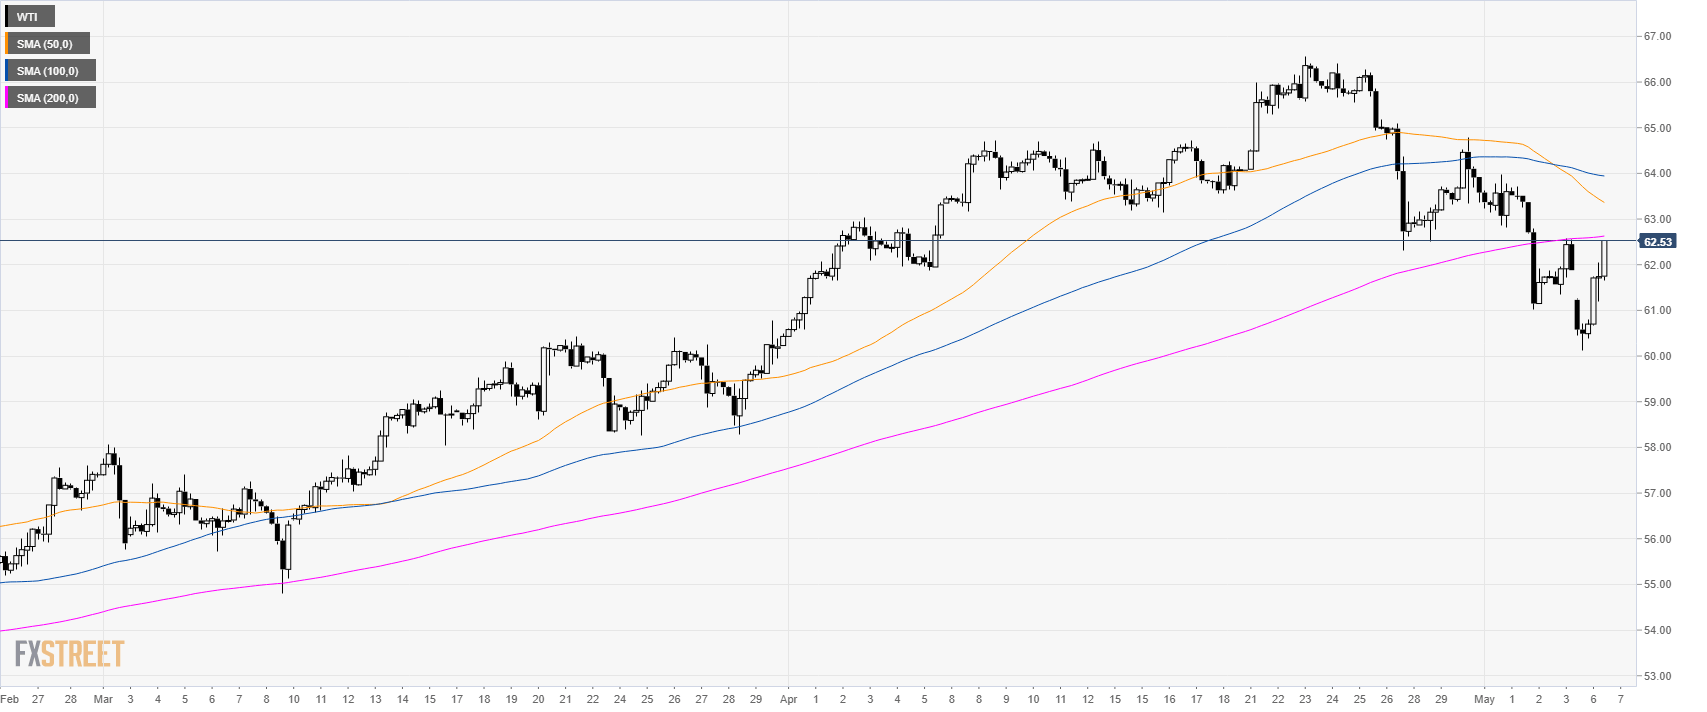
Oil 4-hour chart
- Oil is having a strong reversal from $60.00 a barrel as the market is nearing the 200 SMA now at the 62.63 level.
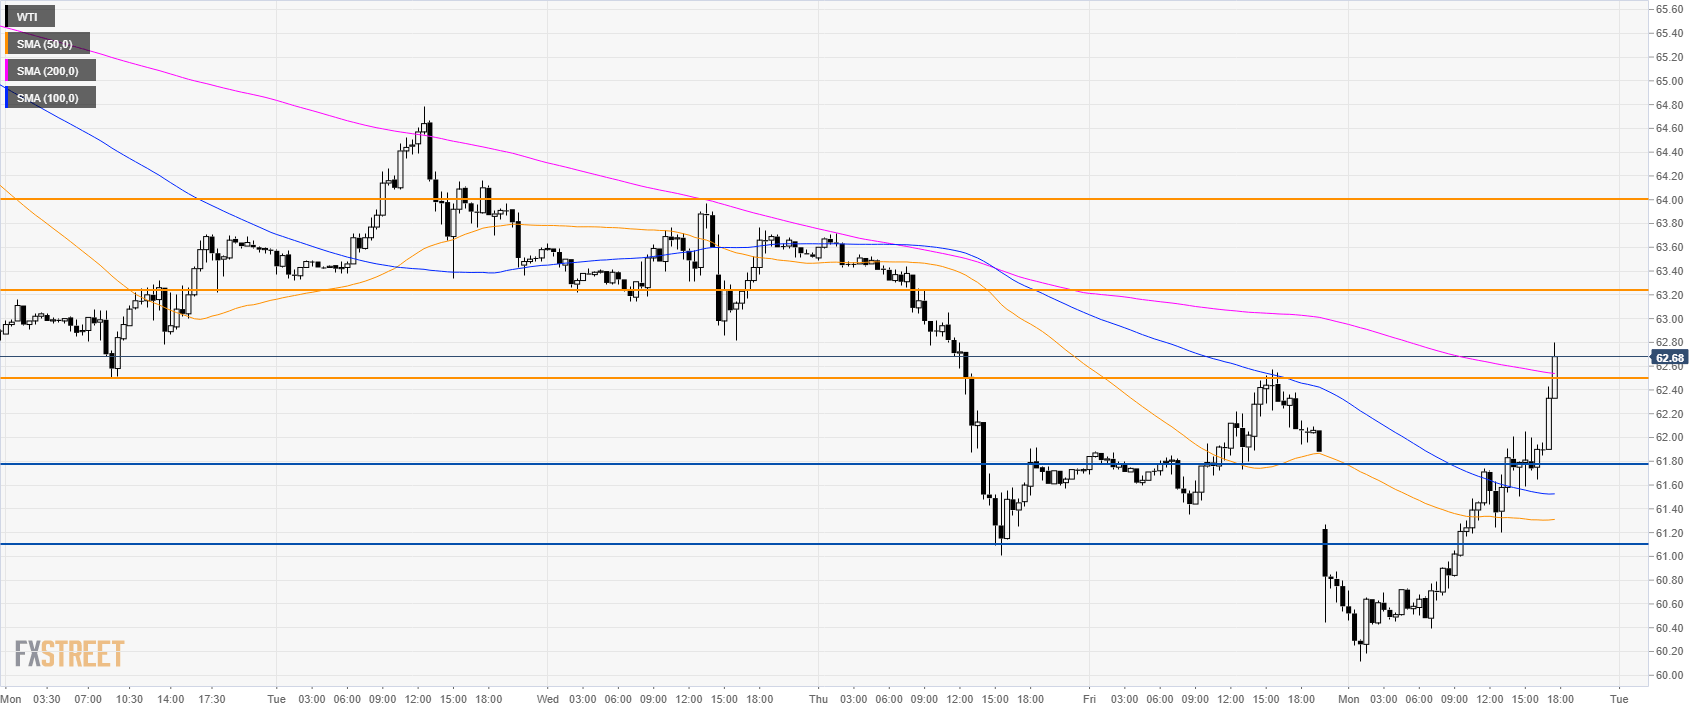
Oil 30-minute chart
- WTI is pushing beyond 62.50 resistance and the 200 SMA.
- Bulls can continue the move up towards 63.20 and 64.00 resistances.
- Support is seen at 62.50 and 61.80 level.
Additional key levels
