- Oil is breaking above June highs and $60.00 a barrel.
- The next resistances to the upside can be located near 62.00 and 64.00.
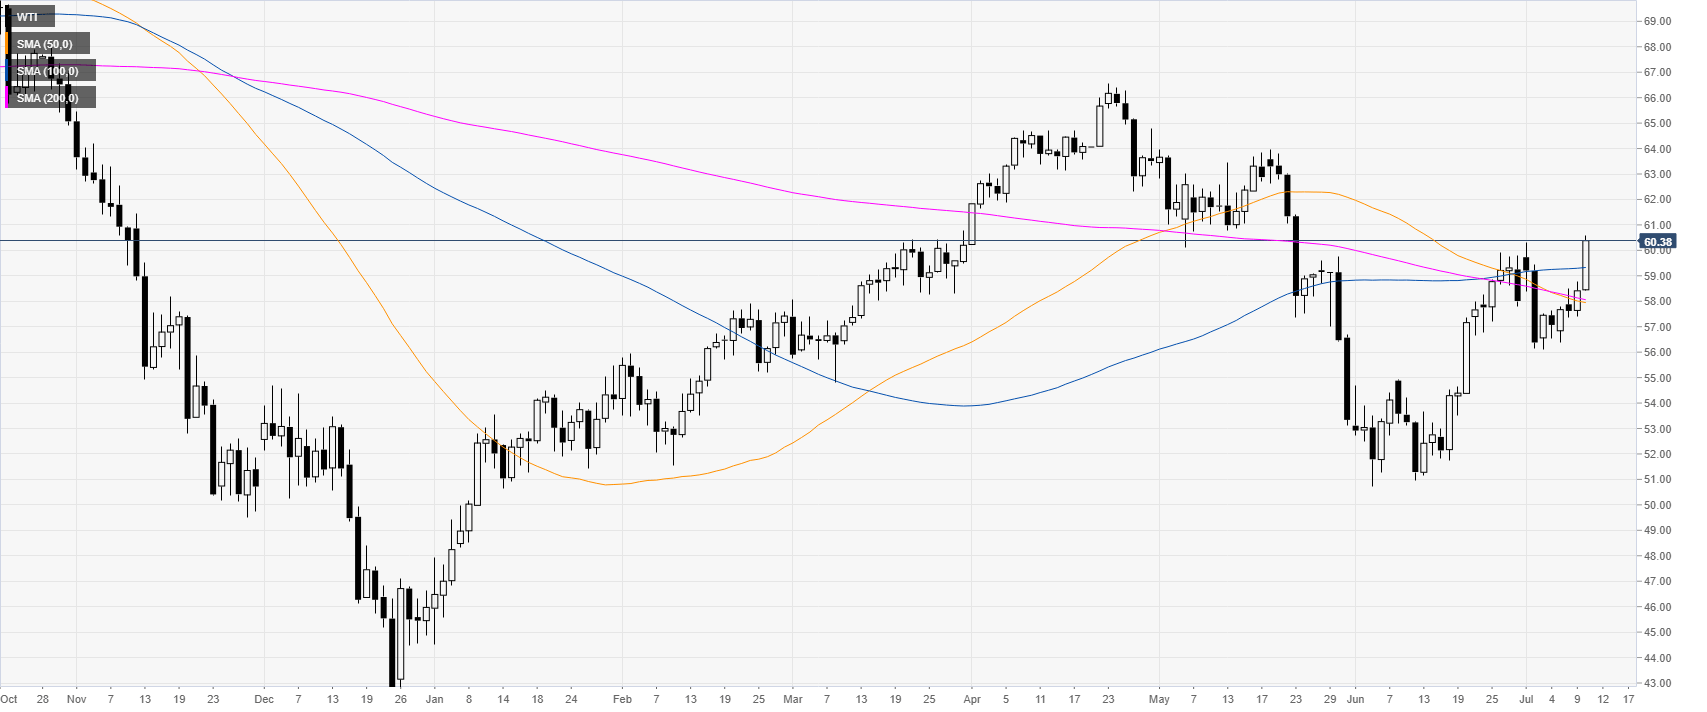
Oil daily chart
WTI (West Texas Intermediate) is trading above June’s high and its main daily simple moving averages (DSMAs).

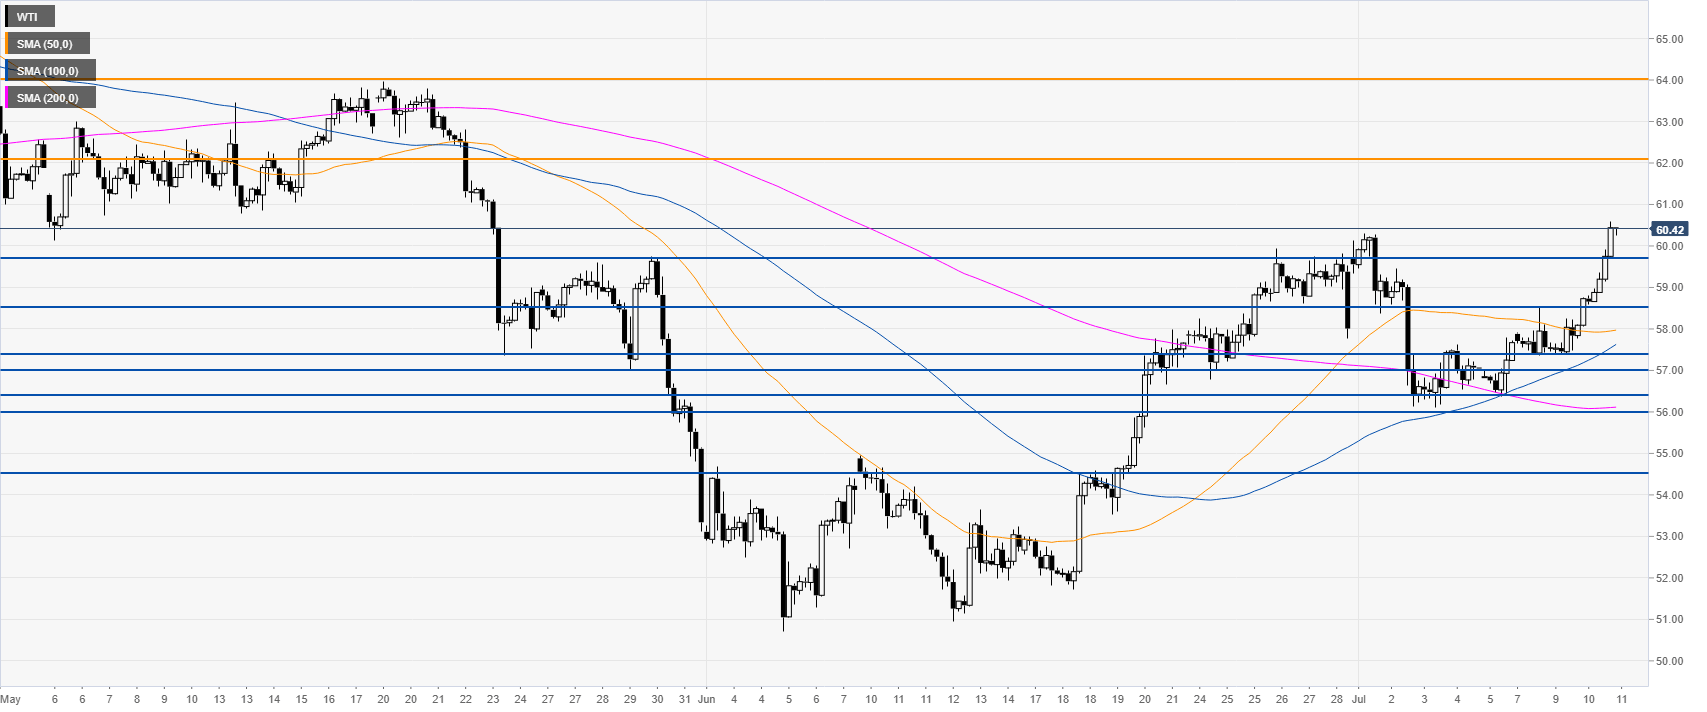
Oil 4-hour chart
Oil is in a bull trend above its main SMAs. Bulls likely intend to reach $62.00 a barrel and 63.00 to the upside.
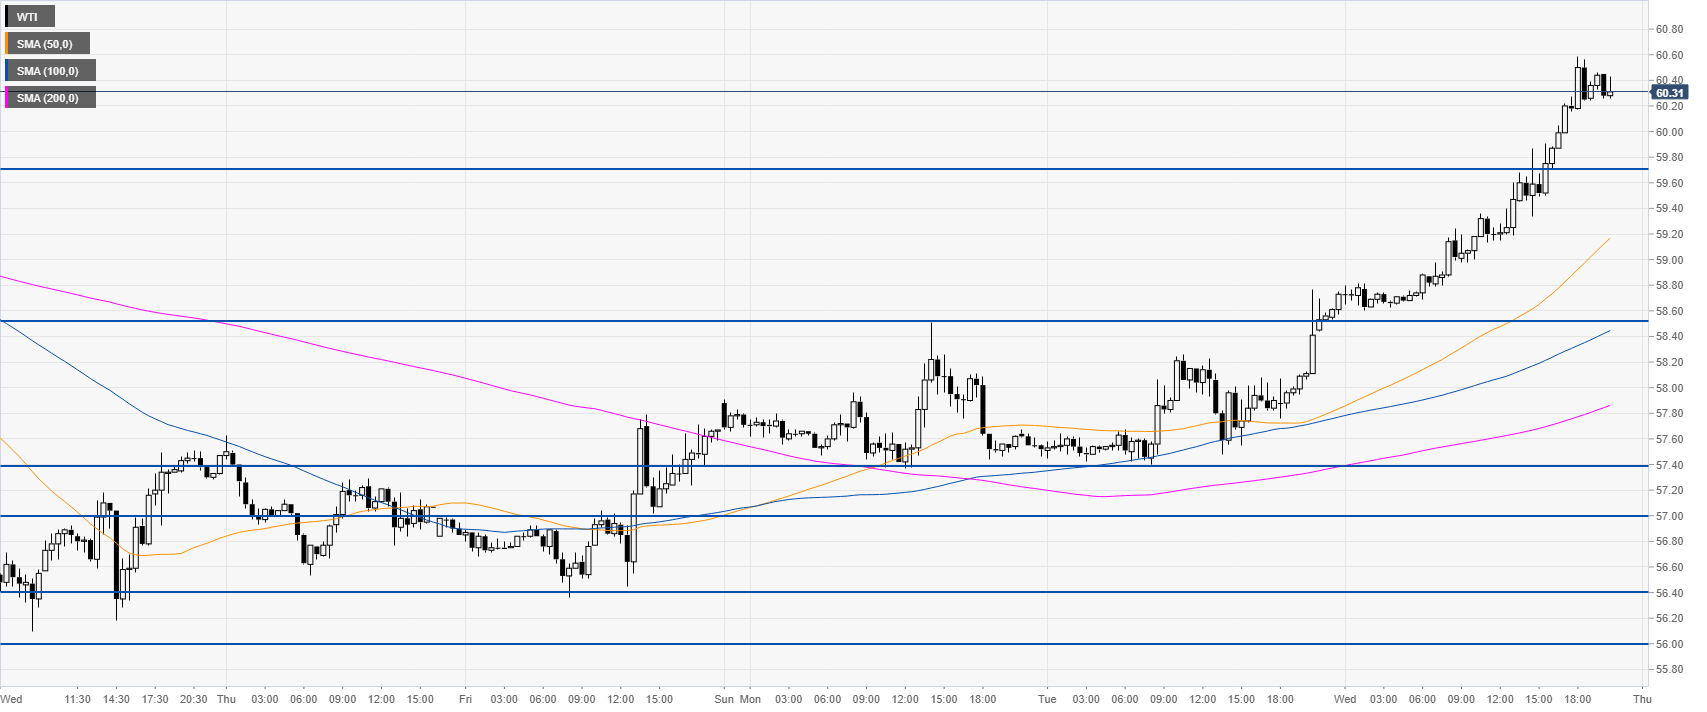
Oil 30-minute chart
Oil is trading above its main SMAs suggesting bullish momentum in the near term. Immediate supports are seen at 59.70 and 58.50.
Additional key level