- Oil is in consolidation mode after dropping sharply earlier in the week.
- 56.00 and 55.00 can become bear targets as long 57.70 caps prices.
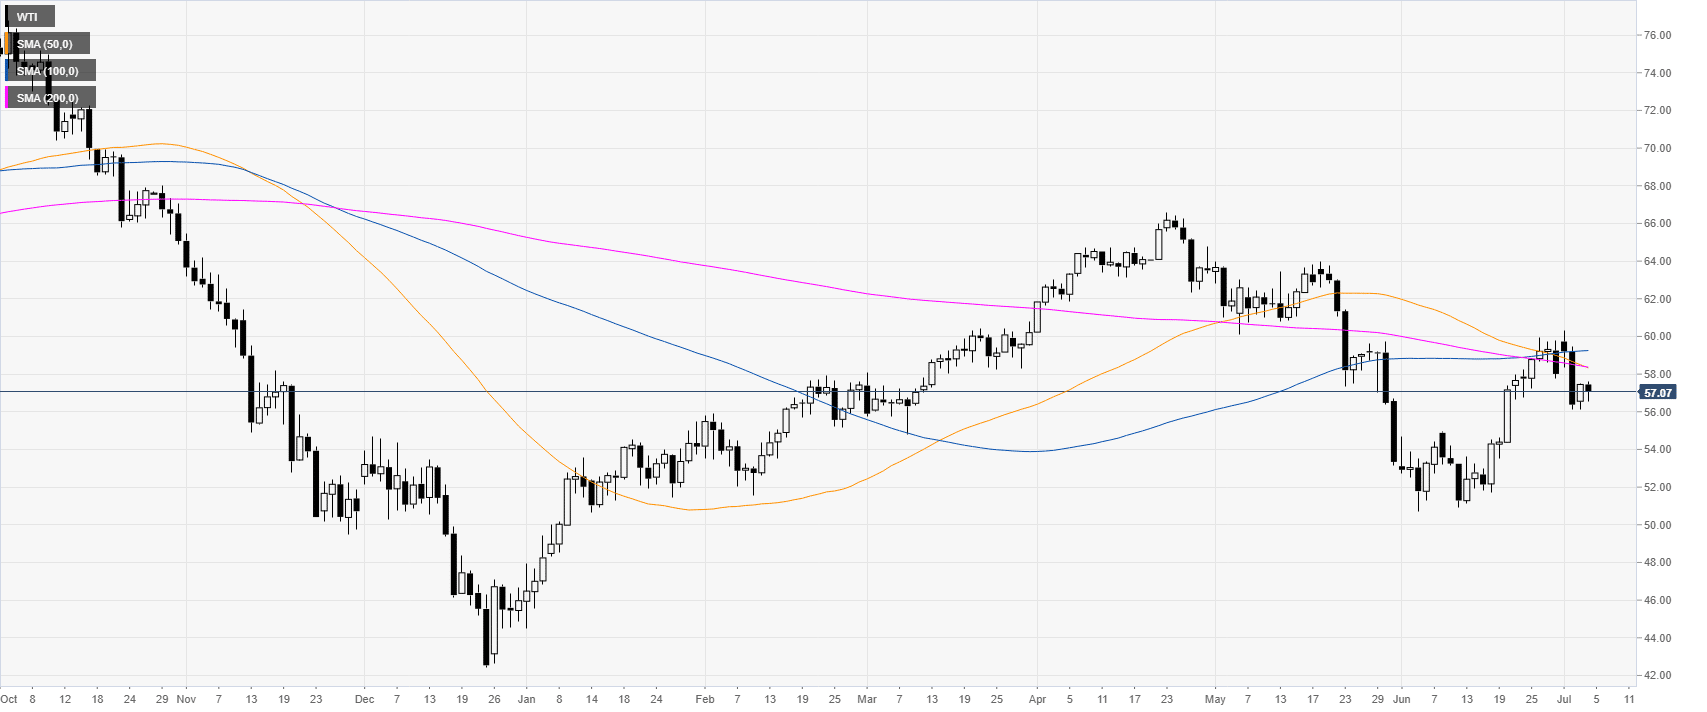
Oil daily chart
WTI (West Texas Intermediate) is consolidating its losses after falling from the recent swing high near $60.00 a barrel. The market is now trading below its main daily simple moving averages (DSMAs).
Oil 4-hour chart
Oil found resistance below the 57.70 resistance and the 50 SMA. The market is trading just above a downward sloping 200 SMA. Below 57.70 resistance the market is likely to stay under bearish pressure. 56.00 and 55.00 can become bearish targets.
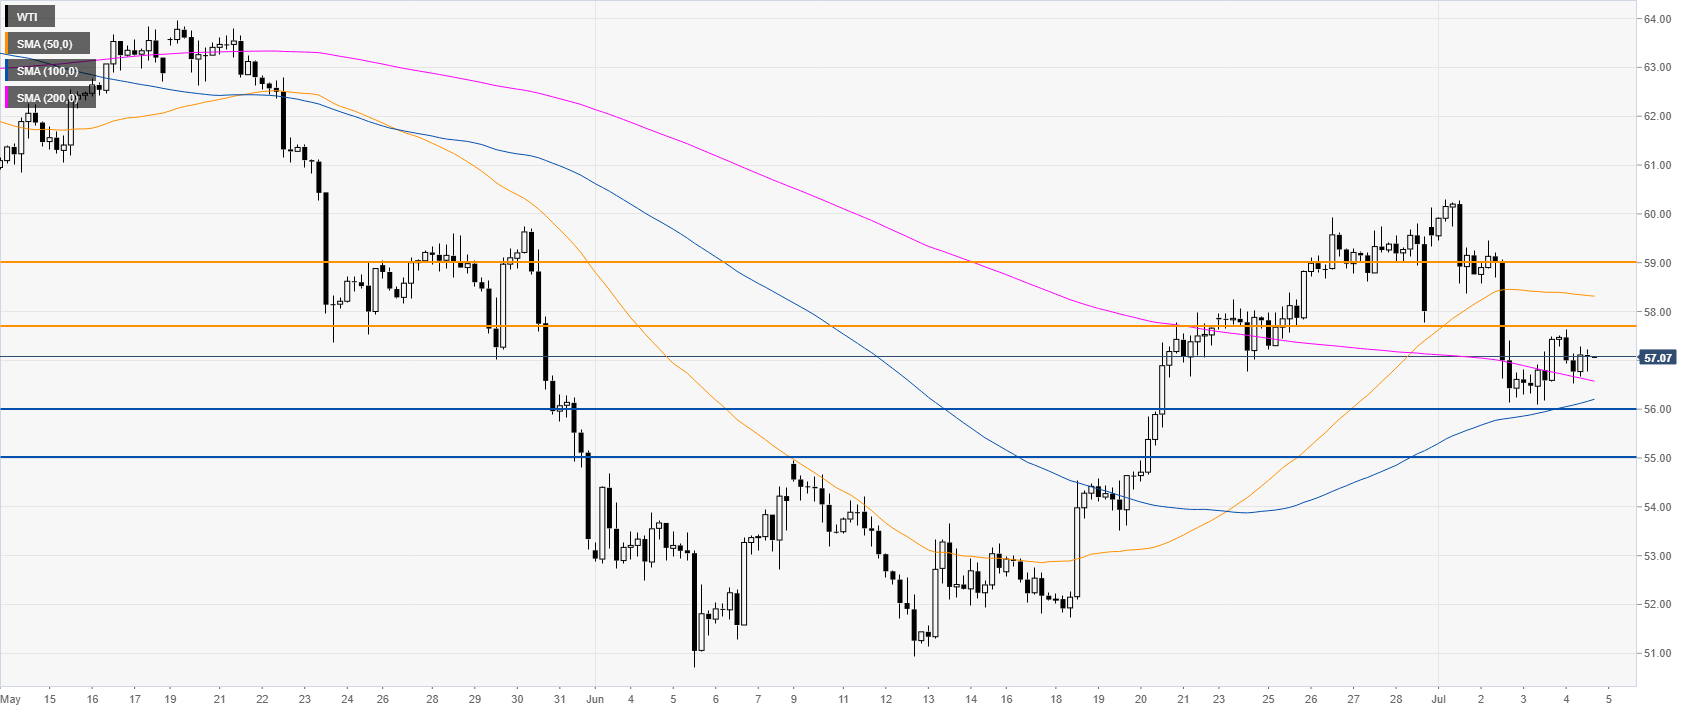
Additional key levels
